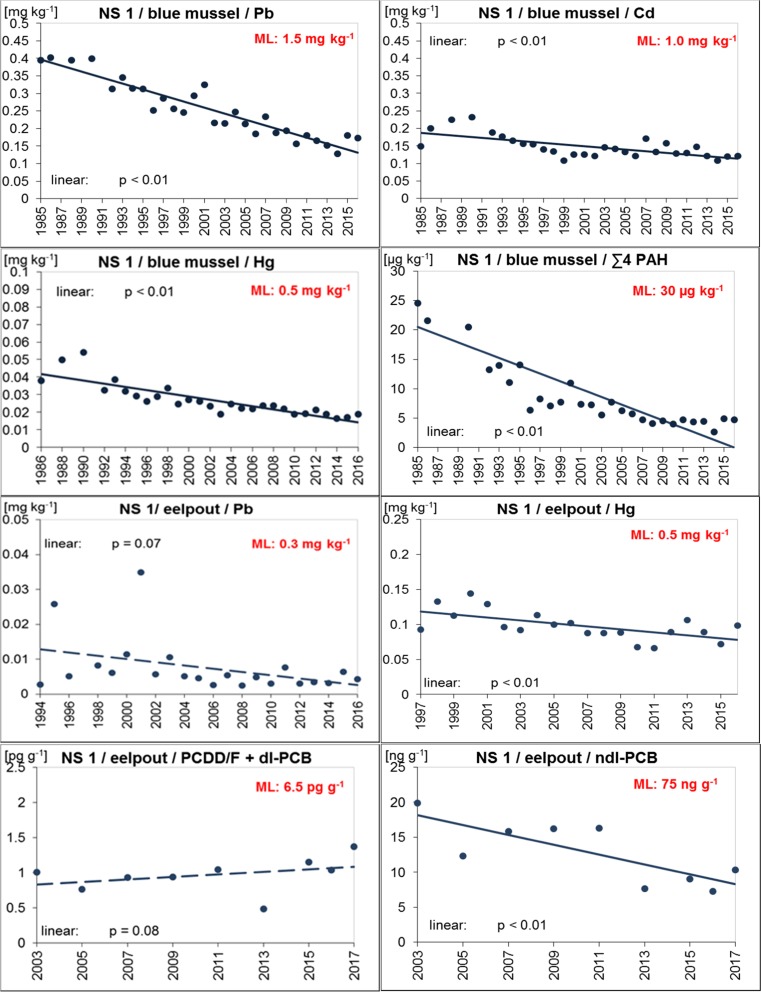
Fig. 2.
Trends of D9 relevant contaminants in ESB samples of blue mussels (soft body) and eelpout (fillet) from the North Sea/Lower Saxony Wadden Sea (coastal region of FAO/ICES Division 27.4.b). The lines represent the results of the linear regression (solid for significant linear trend, dashed for not significant). ML maximum level allowed in fish and fishery products (Reg. (EC) No. 1881/2006 and amendments; EC 2006a, 2008c, 2011a, b, c)

