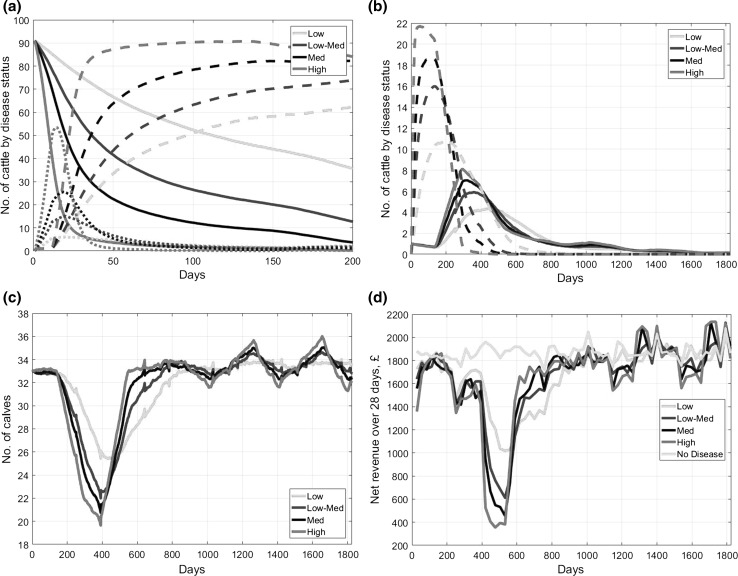
Fig. 2.
Time profiles for a single farm with no control under various disease transmissibilities (low 0.005, low-medium 0.01, medium 0.015, high 0.03) showing (a) number of susceptible (solid line), transiently infected (dotted line) and recovered (dashed line) cattle during the epidemic stage, (b) number of ‘recovered: early-pregnancy’ (dashed line) and persistently infecteds (PIs) (solid line), (c) number of calves and (d) net revenue over 28 days. The transmissibility values are those in Table 1. Sample of 500 for each parameter value.

