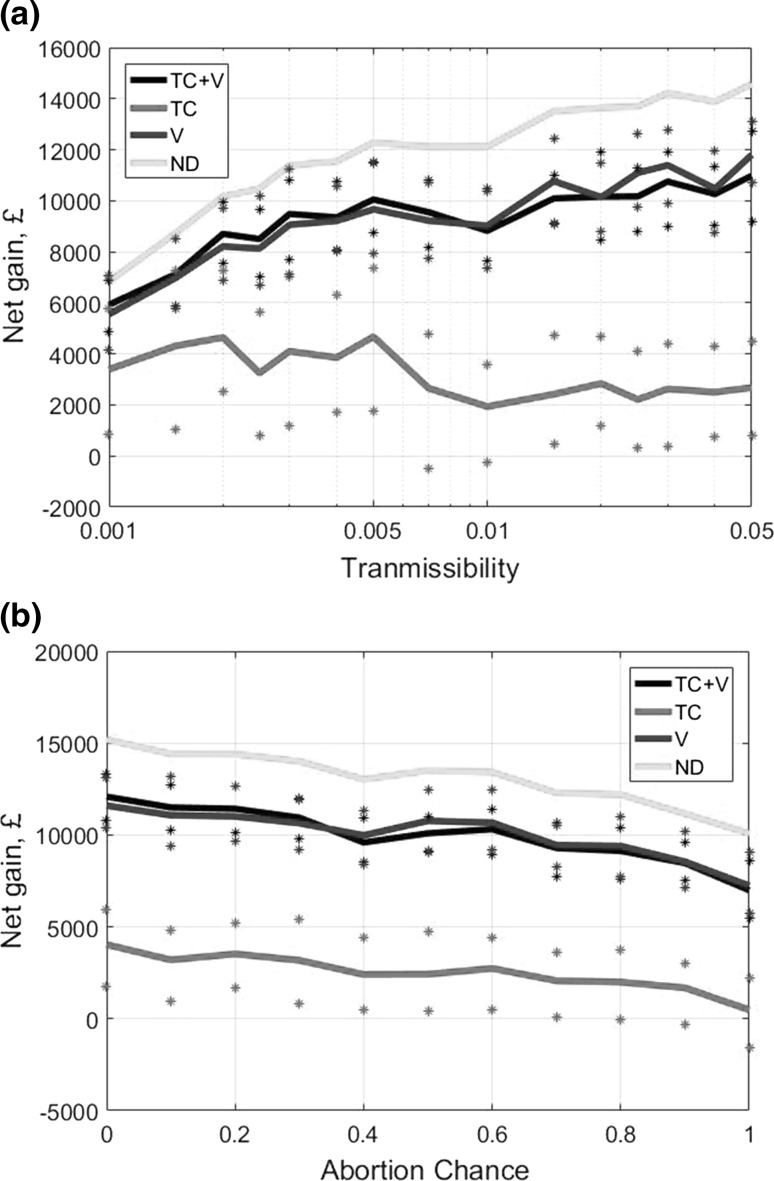
Fig. 3.
Discounted net gains for a single closed farm after 5 years following a BVD outbreak, under different disease management strategies while varying the parameters for (a) transmissibility and (b) abortion rate. Lines are means, and stars represent the upper and lower quartiles. Sample of 100 for each parameter value. TC test-culling, V vaccination, TC + V test-culling and vaccination, ND no disease.

