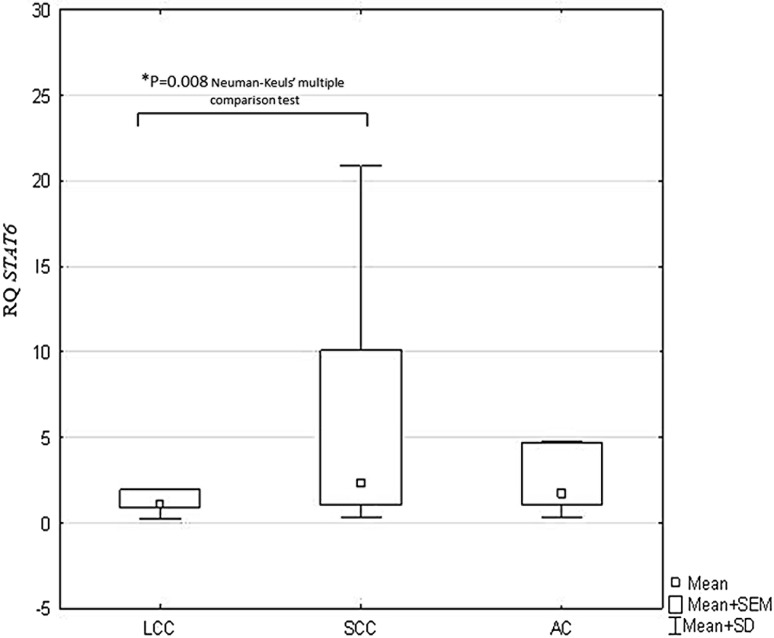
Fig. 3.
Box-and-whisker plots representing mean STAT6 expression in the studied NSCLC subtypes (p = 0.037; ANOVA Kruskal-Wallis test). *Indicates a statistically significant difference between LCC and SCC (p = 0.008; Neuman-Keuls’ multiple comparison test). ANOVA analysis of variance, LCC large cell carcinoma, NSCLC non-small cell lung cancer, SCC squamous cell carcinoma

