Fig. 3.

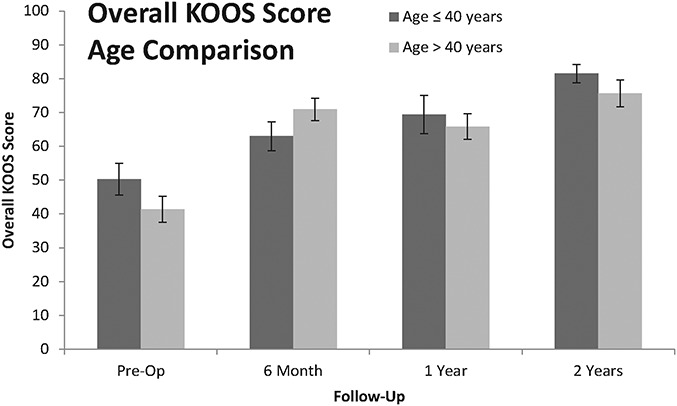
Bar graph showing the mean overall KOOS scores for younger patients (≤40 years old) and older patients (>40 years old). No significant differences were found between these age groups (p > 0.05). The I-bars indicate the standard error.

Bar graph showing the mean overall KOOS scores for younger patients (≤40 years old) and older patients (>40 years old). No significant differences were found between these age groups (p > 0.05). The I-bars indicate the standard error.