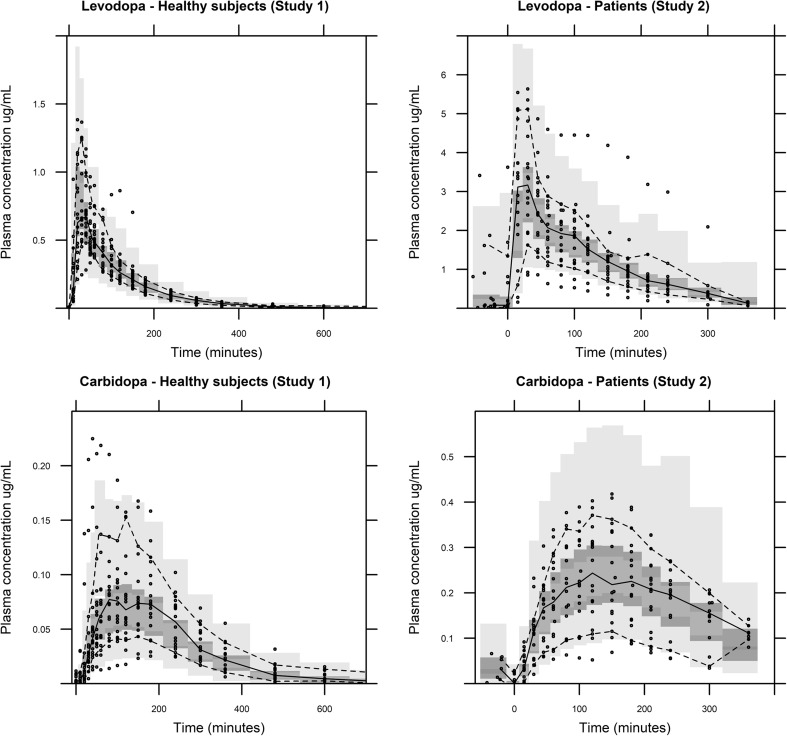
Fig. 1.
Prediction corrected visual predictive check (1000 samples) of the continuous data for the LD/CD dispersible microtablets after covariate model selection stratified on healthy volunteers and PD patients and LD and CD. The solid line is the median of the observed data. The dashed lines represent the observed 10th and 90th percentile of the observations. The top and bottom light gray areas are the 5th and 95th confidence intervals for 10th and 90th percentiles of the simulated data. The middle dark gray area is the 5th and 95th confidence interval for the median of the simulated data

