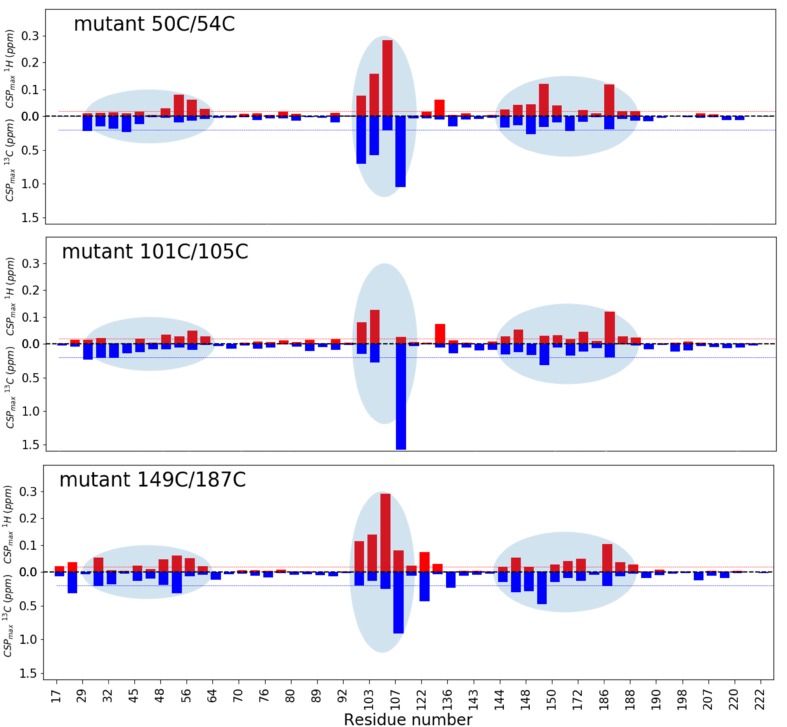
Fig. 6.
Ligand binding. |CSP| are plotted for methyl group resonances upon binding of 1. The 1H and 13C CSP are shown in red and blue bars, respectively. The CSP have been extrapolated to the 100% bound state. The red and blue lines mark 0.02 and 0.2 ppm, respectively. The light blue ovals highlight the most perturbed methyl groups

