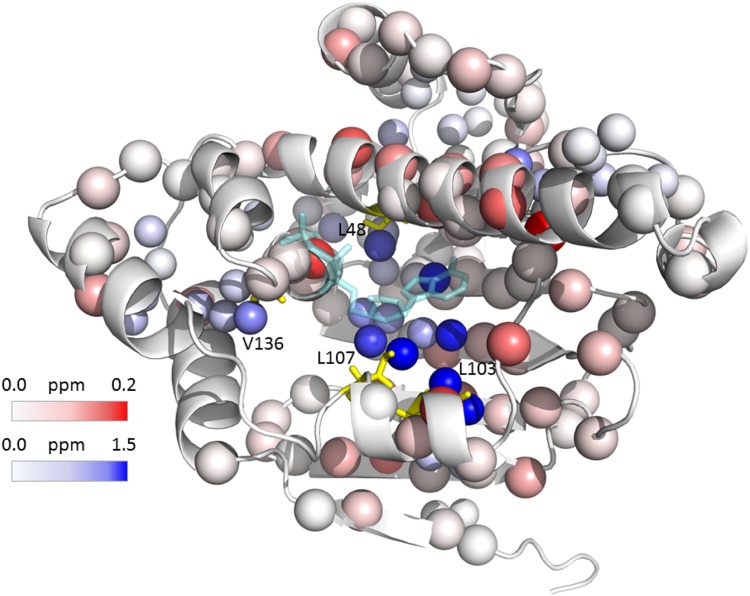
Fig. 7.
CSP map for binding of 1 to ntd-HSP90. The smaller spheres represent the Leu and Val methyl groups, coloured in a gradient of white to blue for increasing CSP as observed in the titration of mutant 50C/54C tagged with CLaNP-5 (Lu3+). The larger spheres represent the amide nitrogens that were observed in a titration of WT ntd-HSP90, coloured according the average amide CSP (from white to red). The residues L48, L103, L107 and V136, harboring a methyl group with |ΔPCS| > 0.04 ppm for at least two mutants, are shown in yellow sticks. The structure is taken from PDB entry 3t0z. The ATP ligand observed in that structure is indicated by semi-tranparent, cyan sticks to indicate the binding site

