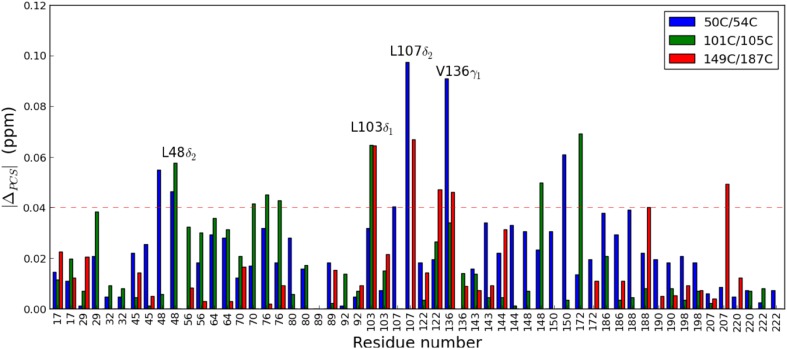
Fig. 8.
PCS changes upon ligand binding. |ΔPCS| for Leu/Val methyl groups for the bound state are shown as blue, green and red bars for the mutants 50C/54C, 101C/105C and 149C/187C, respectively. The red dashed line represents the threshold of 0.04 ppm, based on the estimated error. The conservative maximum experimental error in the chemical shifts is estimated to be 0.02 ppm. The propagated error in ΔPCS is thus 0.04 ppm

