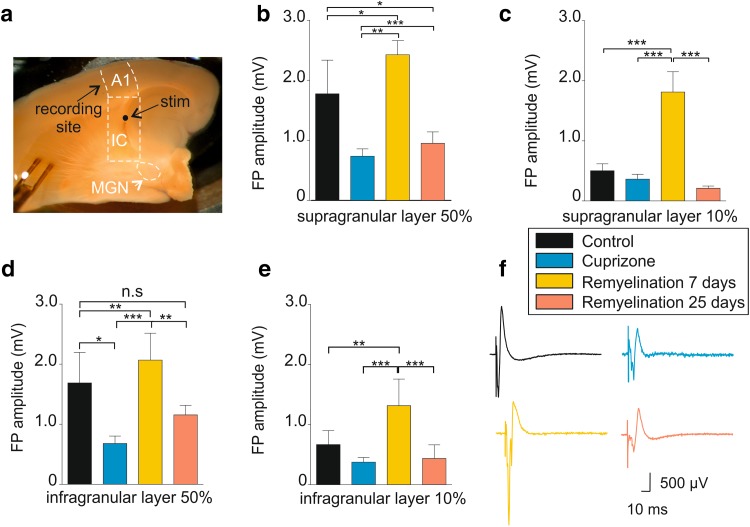
Fig. 2.
Electrophysiological analysis of the auditory thalamocortical system during de- and remyelination. a Micrograph shows the preserved auditory thalamocortical pathway in acute brain slice with auditory thalamus (MGN), internal capsule (IC), and primary auditory cortex (A1). The position of electrical stimulation (stim) is indicated. b, c Bar graphs showing the change in the LFP amplitude in the four experimental groups for 50 and 10% stimulus intensities in the supragranular layer. d, e Bar graphs showing the change in the LFP amplitude in the four experimental groups for 50% and 10% stimulus intensities in the infragranular layer. f Example traces showing the LFP components for all experimental groups in response to 50% SI. *p < 0.05, **p < 0.01, ***p < 0.001

