Fig. 3.
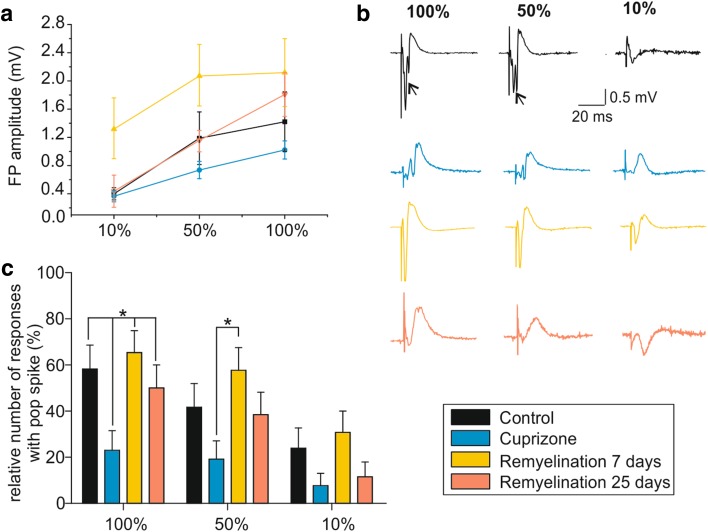
Basic neuronal response changes following de- and remyelination. a Extracellular recordings of local FP in response to increasing stimulus intensities (10, 50, and 100% when 50% ~ 500 µA) were used to generate input/output curves. b Example traces showing LFP components for all experimental groups and the three different stimulation intensities. Arrows indicate population spikes (i.e., the summed action potentials (APs) of many neurons). c Bar graph showing the difference in the threshold for generation of a population spike in the different groups. For each SI, the presence or absence of population spikes in the LFP was determined and expressed as a percentage of the total number of slices analyzed. *p < 0.05

