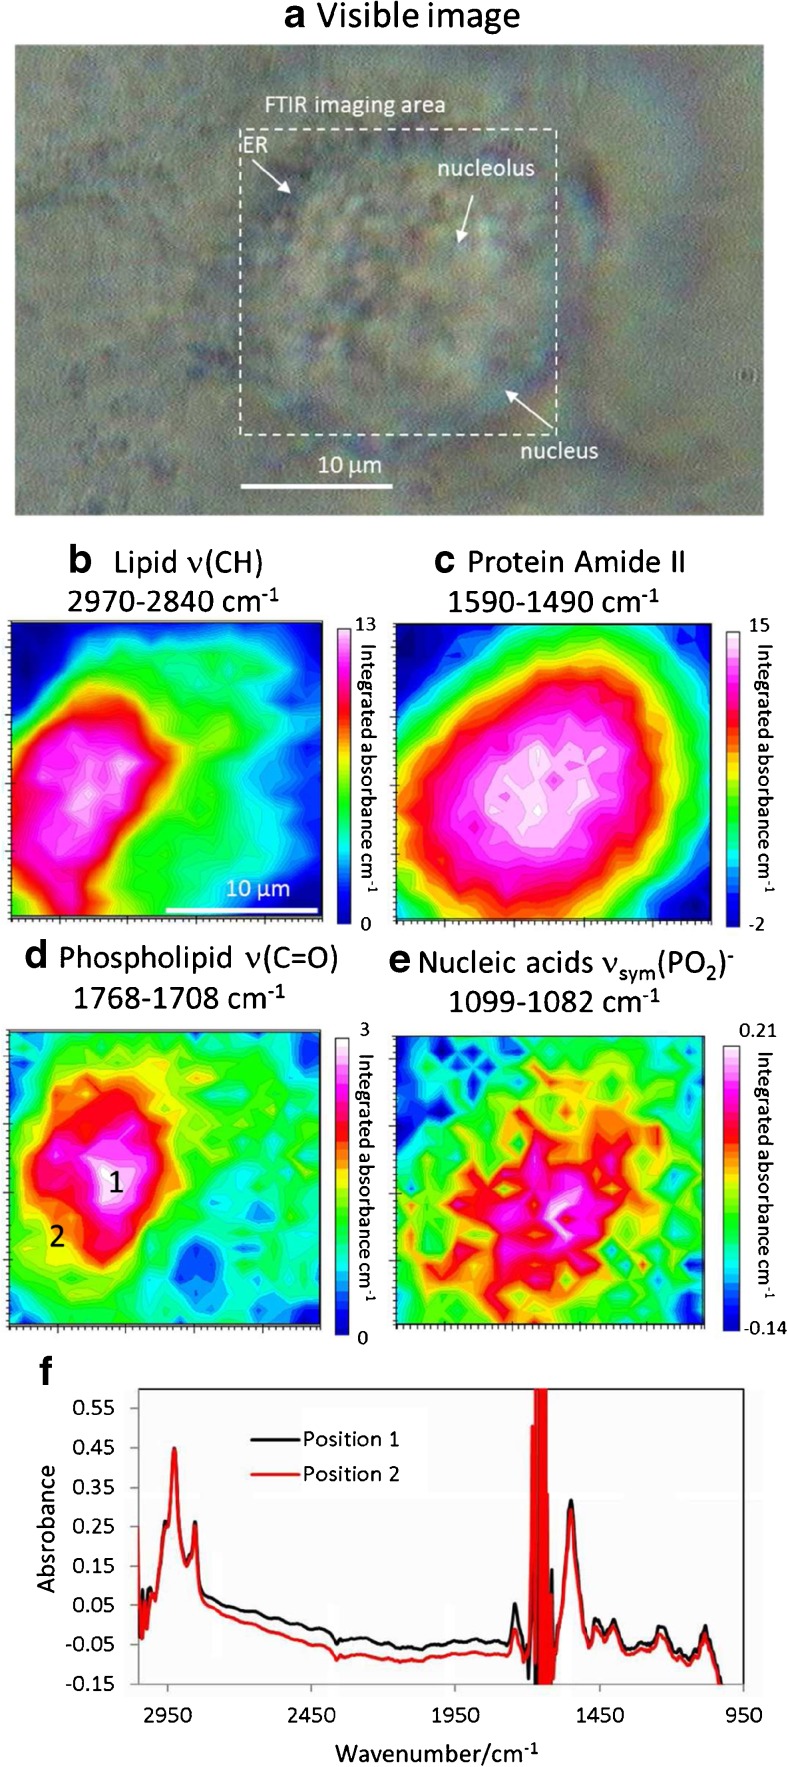
Fig. 4.
Visible imaging (a) and FTIR images (b–e) of the living A549 cell in the region surrounding the nucleus in the ZnS hemispheres transmission device using an effective aperture size of 2.7 μm. Integration range 2970–2840 cm−1, 1768–1708 cm−1, 1590–1490 cm−1 and 1099–1082 cm−1 respectively represent the distribution of overall lipid (b), fat/phospholipids (d), the overall protein (amide II) (c) and nucleic acids (e). (f) shows the extracted spectra from positions 1 and 2 shown in d

