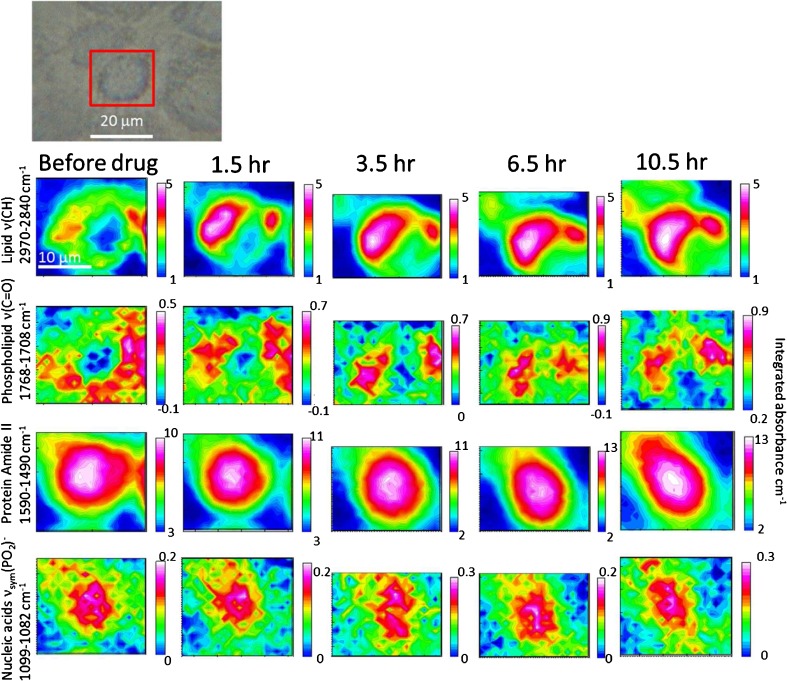
Fig. 5.
FTIR images of an A549 cell in the region surrounding the nucleus before and after exposure to 0.5 μM doxorubicin. The visible image of the measured A549 cell is shown at the top with the red square showing the approximate location where the FTIR images were measured. The colour scales used are shown on the right of each individual image

