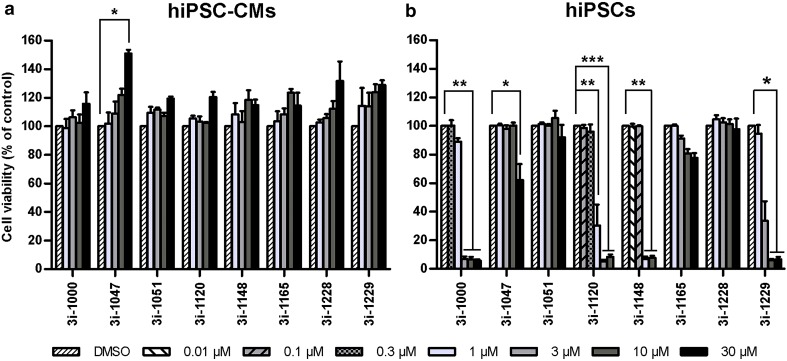
Fig. 5.
Effects of the test compounds on a hiPSC-CM and b hiPSC viability. Cell viability was determined with the MTT assay after a 24-h compound exposure. Results are expressed as mean + SEM (n = 3–4). ***P < 0.001 vs. DMSO; **P < 0.01 vs. DMSO; *P < 0.05 vs. DMSO (one-way ANOVA followed by Tukey’s HSD or Welch ANOVA followed by Games–Howell)

