Fig. 8.
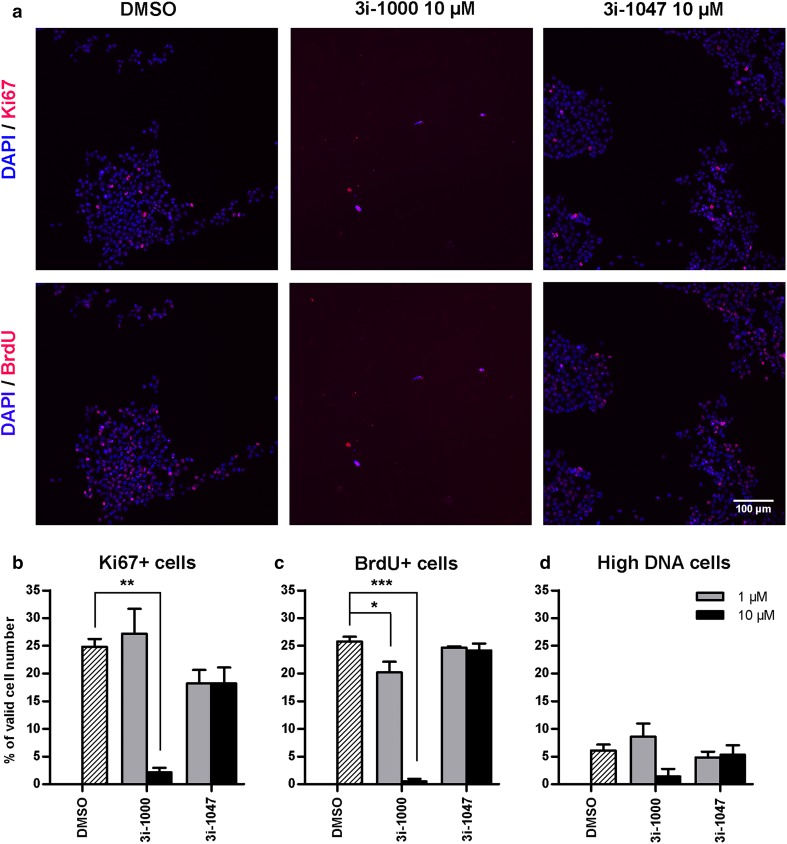
Effects of compounds 3i-1000 and 3i-1047 on cell proliferation in hiPSCs. After a 24-h compound exposure, the cells were loaded with BrdU (1 h) and subsequently fixed and stained for DNA (DAPI), Ki67 and BrdU. Imaging and analysis was carried out using CellInsight High Content Analysis Platform. a Representative images from three independent experiments are shown. Adjustments of individual color channels to enhance brightness and contrast were made identically to all representative images. The analysis results for the percentage of b Ki67-positive cells, c BrdU-positive cells, and d cells with high DNA staining are expressed as mean + SEM (n = 3). ***P < 0.001 vs. DMSO; **P < 0.01 vs. DMSO; *P < 0.05 vs. DMSO (one-way ANOVA followed by Tukey’s HSD or Welch ANOVA followed by Games–Howell)

