
Fig. 3.
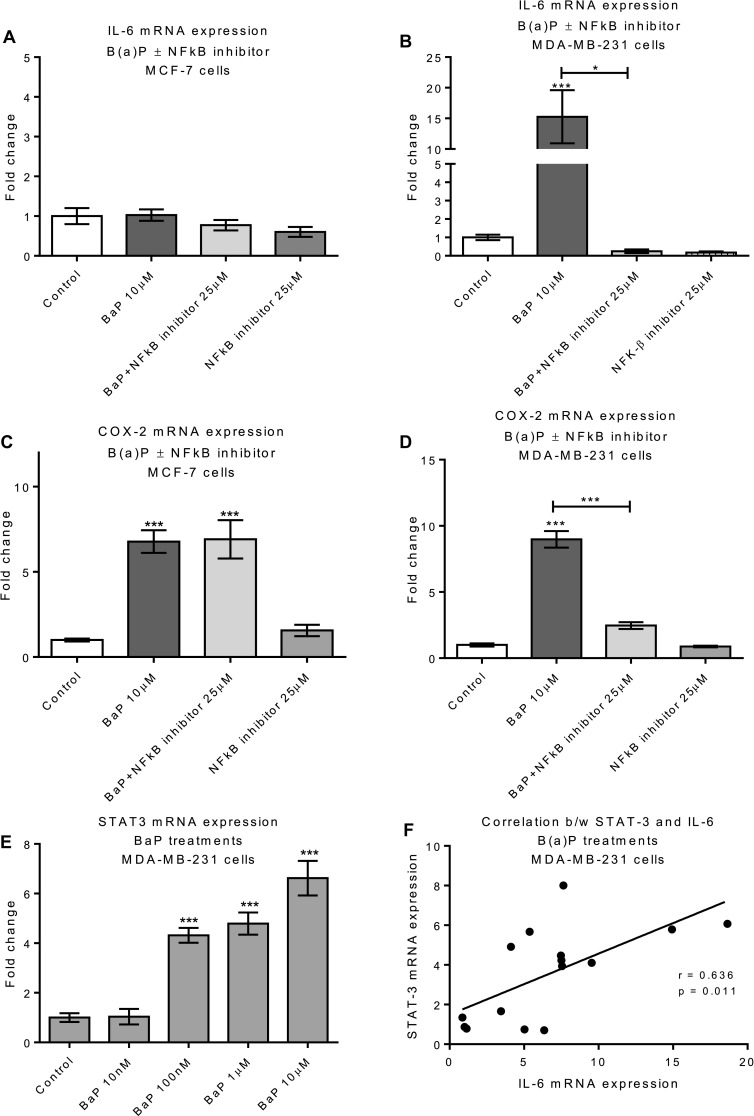
Effect of B(a)P and NFκB inhibition on IL-6, COX-2 and STAT3 expression. Cells were pretreated with 25 µM NFκB inhibitor for 24 h followed by 6 h B(a)P treatment and IL-6 and COX-2 mRNA expression was determined by qPCR in MCF-7 (a, c) and MDA-MB-231 (b, d). The effect of B(a)P on STAT3 expression in MDA-MB-231 cells (e) was assessed after 6 h of B(a)P treatment. Data were normalized to mRNA expression of GAPDH and are shown relative to control (0.1% DMSO). Statistical difference between two groups (B(a)P vs B(a)P + NFκB inhibitor) was determined by student t test. Statistically significant differences were calculated using one-way ANOVA with a Dunnett post-test (GraphPad Prism 5) (***p < 0.001, **p < 0.01, *p < 0.05). Data are presented as a mean of at least three independent cultures. Error bars represent the S.E.M. f Correlation between STAT3 and IL-6 mRNA expression in B(a)P-treated MDA-MB-231 cells. Pearson correlation coefficient test was used for correlation analysis (*p < 0.05)