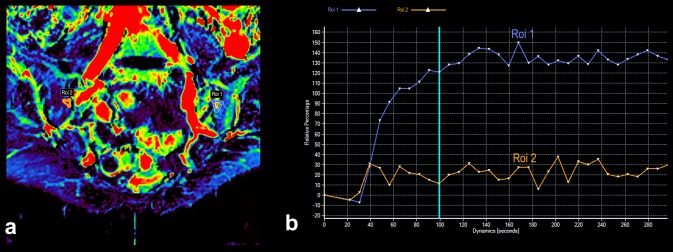
Fig. 4.
Area under the perfusion curve colour-coded map of the sacral region of the person with axSpA, with marked inflammatory lesion in the upper iliac quadrant of the left sacroiliac joint (Roi 1, blue line) and respective unaffected area in the right sacroiliac joint (Roi 2, orange line) (a). The graph of relative percentage enhancement versus time of acquisition showing the pattern of enhancement in typical axSpA active inflammatory lesion (Roi 1, blue line) in comparison to intact, non-enhancing tissue (Roi 2, orange line) (b)

