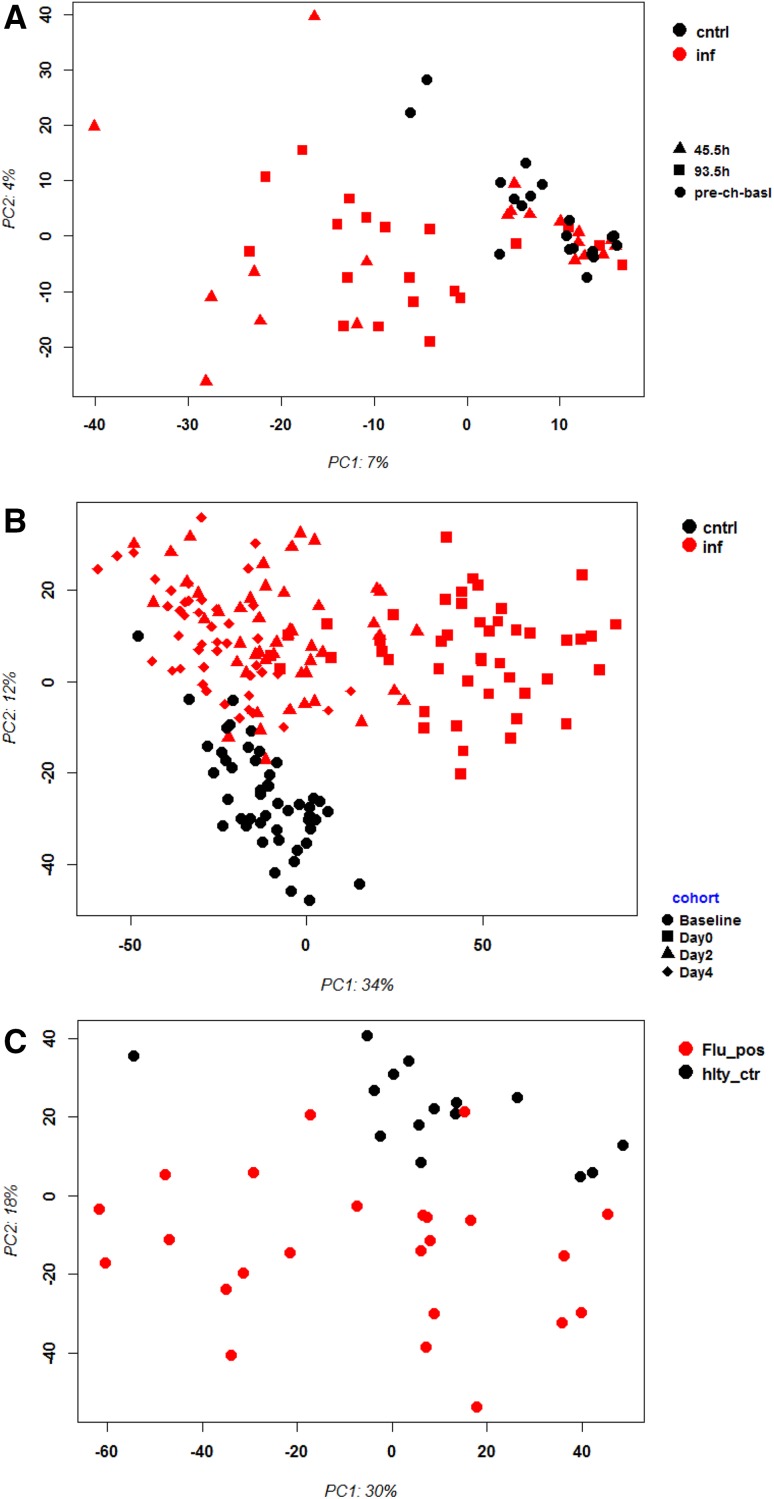
Fig. 2.
Principle component analysis of gene expression values from blood of patients infected with influenza virus. Principle component analysis (PCA) revealed separate grouping of controls versus infected patients and mice. Black: controls, red: infected; days pi are indicated by symbols. a Woods_13, b Zhai_15, (C) Tang_17. cntrl controls, inf infected, pre_ch_basal pre-challenge basal, Flu_pos infected, hlty_ctr healthy controls. Days pi/admission are indicated by symbols. cntrl healthy controls, hlty_ctr healthy controls, inf infected individuals, Flu_pos infected individuals

