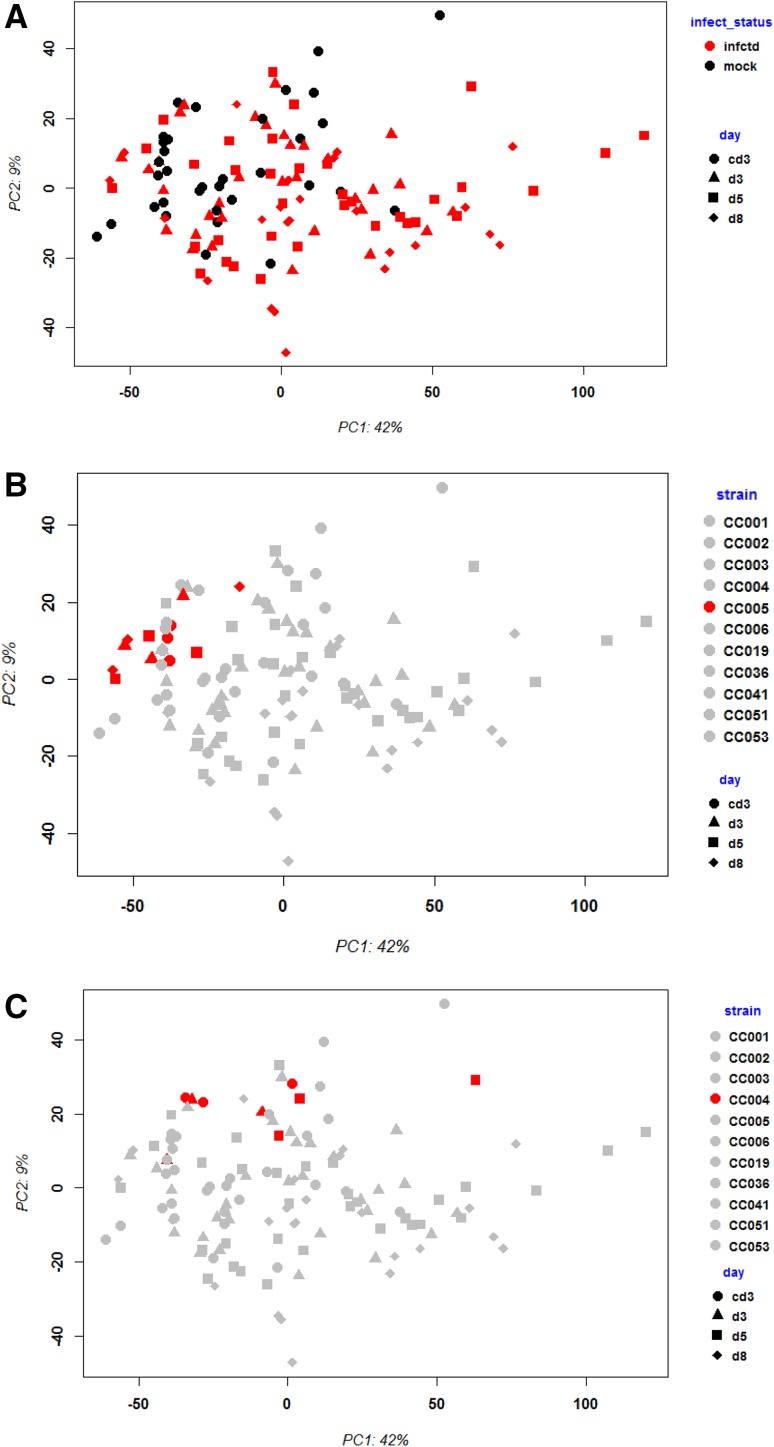
Fig. 3.
Principle component analysis of gene expression values from blood of CC mouse strains after infection with influenza virus. Principle component analysis (PCA) revealed separate grouping of mock controls versus infected mice. a Black: mock-infected controls (mock), red: infected mice (infctd); days pi are indicated by symbols. b and c The same PCA as in (a) highlighting a single CC strain in red; days pi are indicated by symbols. cd3 mock-treated controls at 3 days after treatment, d3 day3 pi, d5 day 5 pi, d8 day 8 pi

