
Fig. 1.
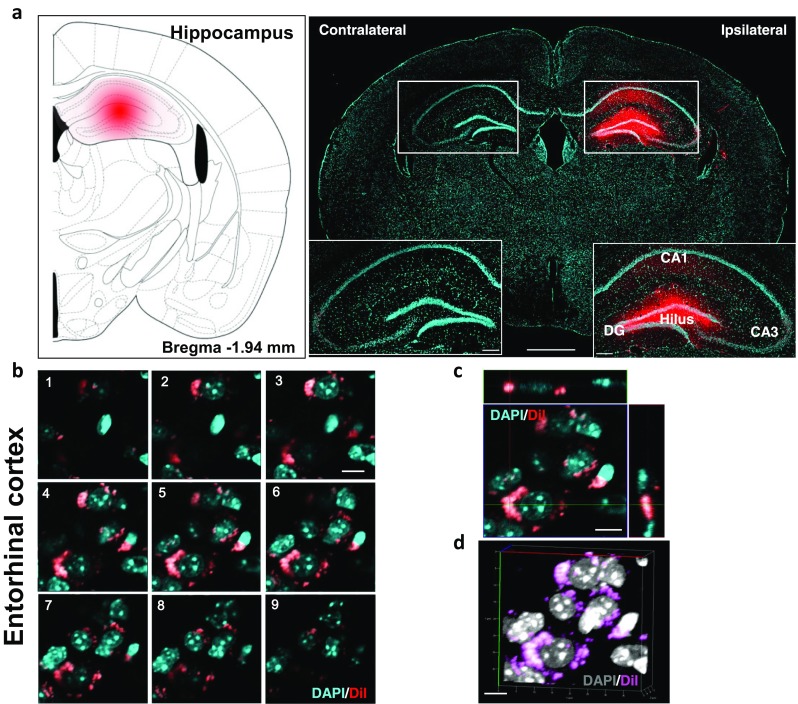
Validation and characterization of the application of the DiI neurotracer in the brains of wild-type mice. a Photomicrographic validation of the stereotaxic injection sites of DiI. The mouse brain atlas diagram illustrates the injection sites. Scale bars = 1 mm and 200 μm for the magnified inserts. b Serial Z-stack images, comprising nine sections, of the subcellular localization of DiI that was retrogradely transported from the hippocampus to the entorhinal cortex. c Orthogonal view of the z-stack images shown in b. The panels on the side and bottom show y–z and x–z cross-sectional images, respectively. d The three-dimensional Z-projection of the acquired stacks. DAPI was used to stain the nuclei. Scale bars = 10 μm b–d