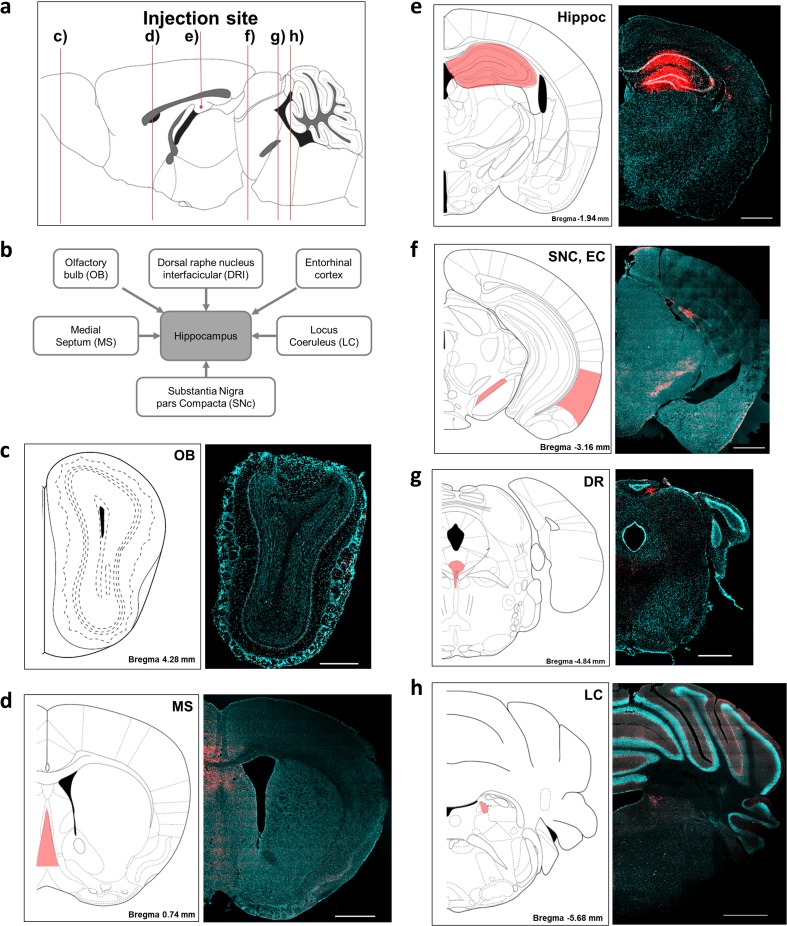
Fig. 2.
Delineating the neural inputs of the hippocampus in the wild-type mice with the neurotracer DiI. a A sagittal view of mouse brain showing representative figures of (c–h). b Schematic drawing of the brain regions that project axons to the hippocampus. DiI fluorescence was observed in c the olfactory bulb (OB), d medial septum (MS), e hippocampus (Hippoc), f substantia nigra pars compacta (SNc), entorhinal cortex (EC), g dorsal raphe (DR), and h locus coeruleus (LC). All tissues were counterstained with DAPI (blue). All figures were captured in the ipsilateral hemisphere. Scale bars = 1 and 500 μm for c

