
Fig. 6.
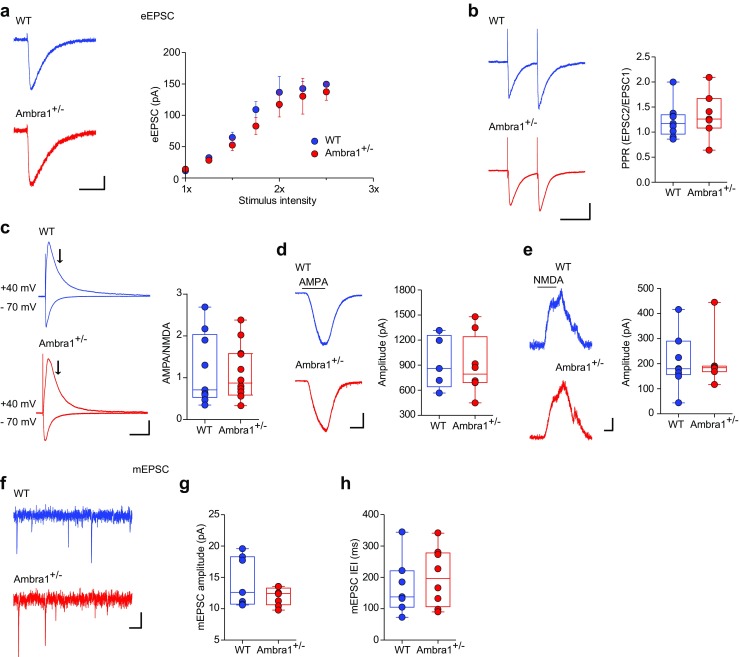
Female Ambra1+/− mice show normal excitatory synaptic transmission onto CA1 pyramidal neurons. a Representative traces at half-maximal stimulation intensity and mean input/output curve (± sem) for eEPSCs recorded from female WT and Ambra1+/− CA1 pyramidal neurons held at − 70 mV (n = 7 WT and 10 Ambra1+/− cells; scale bars: 50 ms, 20 pA) in response to increasing Schaffer collateral stimulation intensity. b The traces are example paired-pulse responses (100 ms interval, − 70 mV; scale bars: 100 ms, 50 pA) of eEPSCs recorded from CA1 pyramidal neurons at half-maximal stimulation. The PPR of excitation is unchanged between the two genotypes (n = 9 WT and 7 Ambra1+/− cells). c Example traces of AMPAR- and AMPAR+NMDAR-mediated eEPSCs at − 70 and + 40 mV, respectively, from a female WT and an Ambra1+/− CA1 pyramidal neuron (scale bars: 100 ms, 40 pA). The AMPA/NMDA ratio for each experiment was calculated from peak AMPAR versus NMDAR currents at 70 ms (arrows) from the stimulus artifact (n = 9 WT and 12 Ambra1+/− cells). d, e Representative AMPA- (d) and NMDA-induced (e) whole-cell currents (scale bars: d, 2 min, 200 pA; e, 1 min, 50 pA) and plots of mean responses, recorded from CA1 pyramidal neurons held at − 70 and +40 mV, respectively. Bars above traces show the duration of bath application. No differences are observed between WT and Ambra1+/− mice (d: n = 5 WT and 8 Ambra1+/− cells; e: n = 9 WT and 7 Ambra1+/− cells). f–h Representative AMPAR-mediated mEPSCs (− 70 mV; scale bars: 100 ms, 5 pA) from female WT and Ambra1+/− CA1 pyramidal neurons (f), with plots showing mean mEPSCs amplitude (g) and IEI (h; n = 7 WT and 8 Ambra1+/− neurons)