Fig. 2.
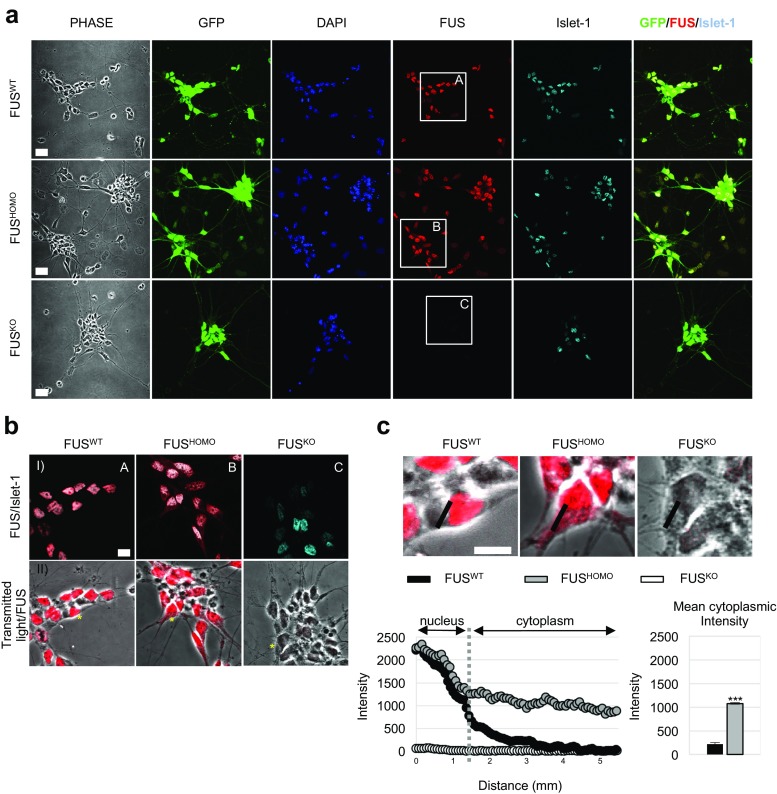
FUS protein localization in mESC-derived MNs: a Multiple immunostaining analysis of FUS (red) and the MN marker Islet-1 (cyan) in FUSWT, FUSHOMO, and FUSKO mixed cell populations cultured for 2 days after EB dissociation and replating. The higher GFP signal is mainly located in Islet1(+) cells. No significant FUS signal was found in FUSKO cells. Nuclear staining with DAPI (4′,6-diamidino-2-phenylindole) is reported in blue. Scale bar: 20 μm. b Magnification of square inserts (A, B, C) reported in a showing FUS and Islet-1 double immunofluorescence (row I) or FUS staining combined with transmitted light (row II). c Representative line scan analysis of the FUS signal intensity in MNs indicated by asterisks in B (row II). A fluorescent intensity value along the black line drawn across the nucleus and cytoplasm (upper panel) was plotted versus distance (bottom chart). Note the shift in cytoplasmic intensity profile in FUSHOMO (gray dots) with respect to FUSWT (black dots) and FUSKO (white dots). The histogram on the left represents the mean (+/− SEM) of cytoplasmic intensity between FUSWT and FUSHOMO MNs. Scale bar: 10 μm. Results (+/− SEM) are expressed in arbitrary units

