
Fig. 5.
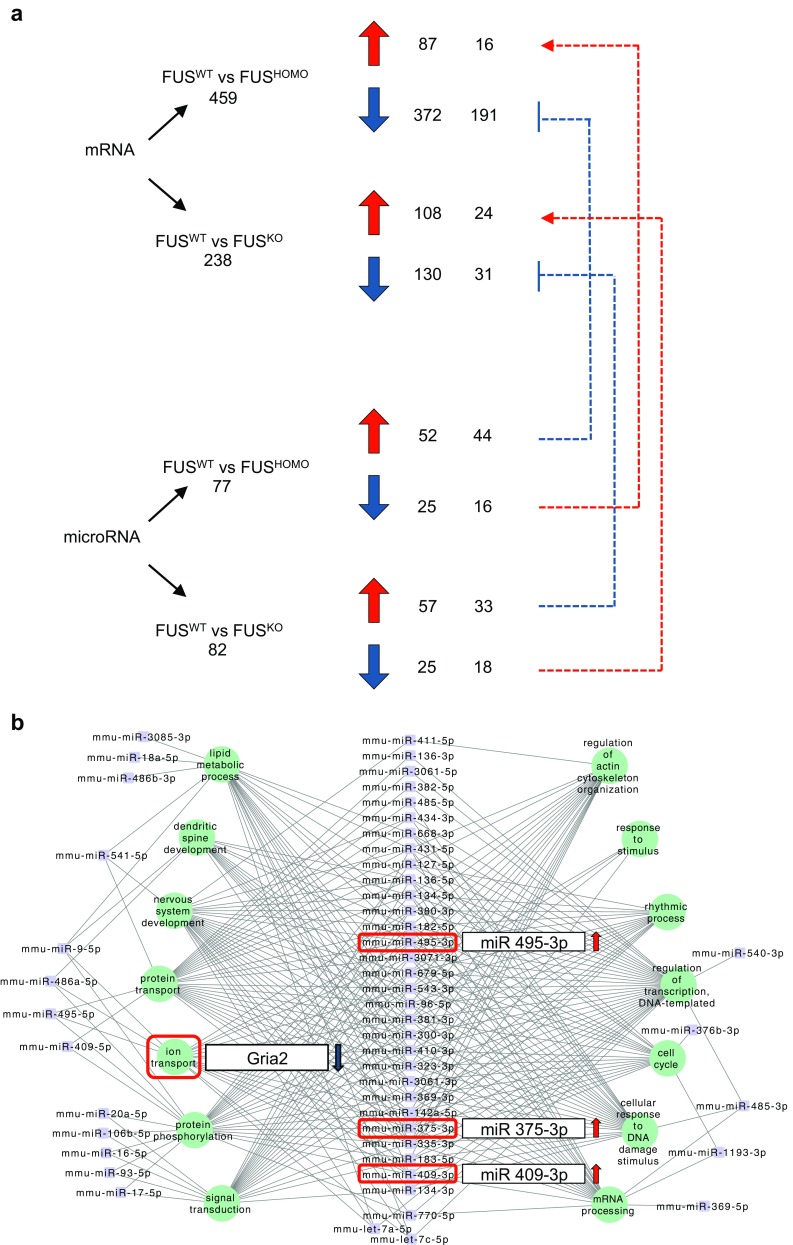
Differentially expressed mRNA and miRNA cross-analysis. a Diagram showing, for each sample, the numbers of upregulated (red arrows) and downregulated (blue arrows) mRNAs and microRNAs, with opposing differential expression patterns. Blue dashed lines and red dashed arrows lines indicate negative and positive interactions between microRNAs and mRNAs, respectively. b Networking between upregulated microRNAs (purple dots) and downregulated predicted targets mRNAs (clustered in functional categories and represented as green dots) in FUSHOMO MNs. Ion transport category, Gria2 gene, and microRNAs (miR-409-3p, miR-495-3p, and miR-375-3p) are highlighted