Fig. 4.
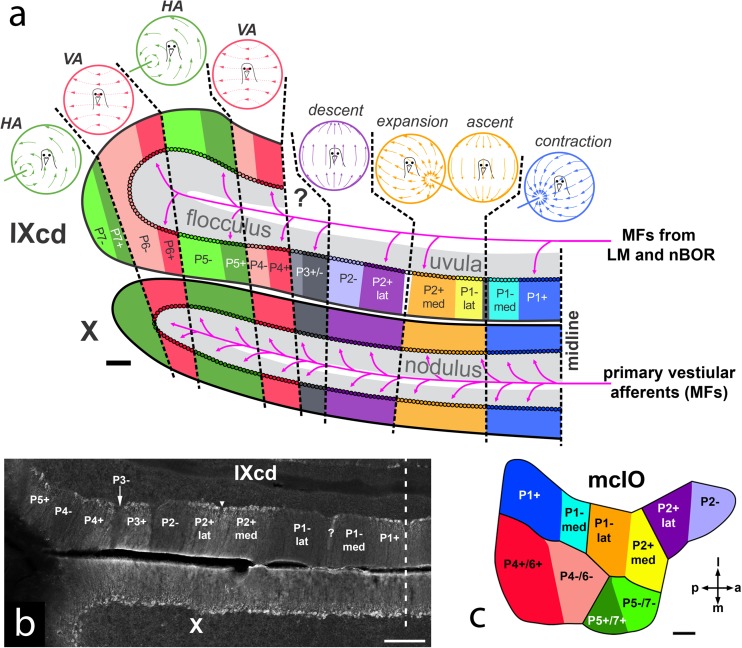
a Diagram of the optic flow modules in the pigeon vestibulocerebellum (VbC; folia IXcd and X) (based on data from [66–69]. The lateral half of the VbC is the flocculus, the medial half is the uvula (IXcd)/nodulus (X). Each module is represented by a depiction of the optic flowfield that maximally excites the complex spike activity (CSA) of the Purkinje cells (PCs). The ZII+ and ZII− stripes in IXcd are also indicated. (All PCs in X are uniformly ZII+). There are seven optic flow modules, each spanning a ZII+/− stripe pair (see text for details). P3+/− PCs do not respond to optic flow. The magenta arrows indicate the primary vestibular afferents, which project as mossy fibers (MFs) to X. Magenta arrows also show the optic flow MF inputs from the nucleus of the basal optic root (nBOR) and pretectal nucleus lentiformis mesencephali (LM) to the ZII+ stripes in IXcd. b Coronal section through ventral IXcd and dorsal X, showing the ZII expression. The inverted triangle indicates the “notch” where PCs are absent, and bisects the P2+ stripe in to medial and lateral halves (P2+med, P2+lat). The “?” indicates a ZII+ stripe, 1 to 3 PCs in width, which similarly divides the P1−stripe (P1−med, P1−lat). The vertical dashed line indicates the midline. c Dorsal view of the medial column of the inferior olive (mcIO) and is color-coded to match the ZII stripes in (a), to indicate the topography of the climbing fiber projections (based on data from [32, 33]). a anterior, p posterior, m medial, l lateral. Scale bars: 200 μm in (a), 300 μm in (b), 100 μm in (c)

