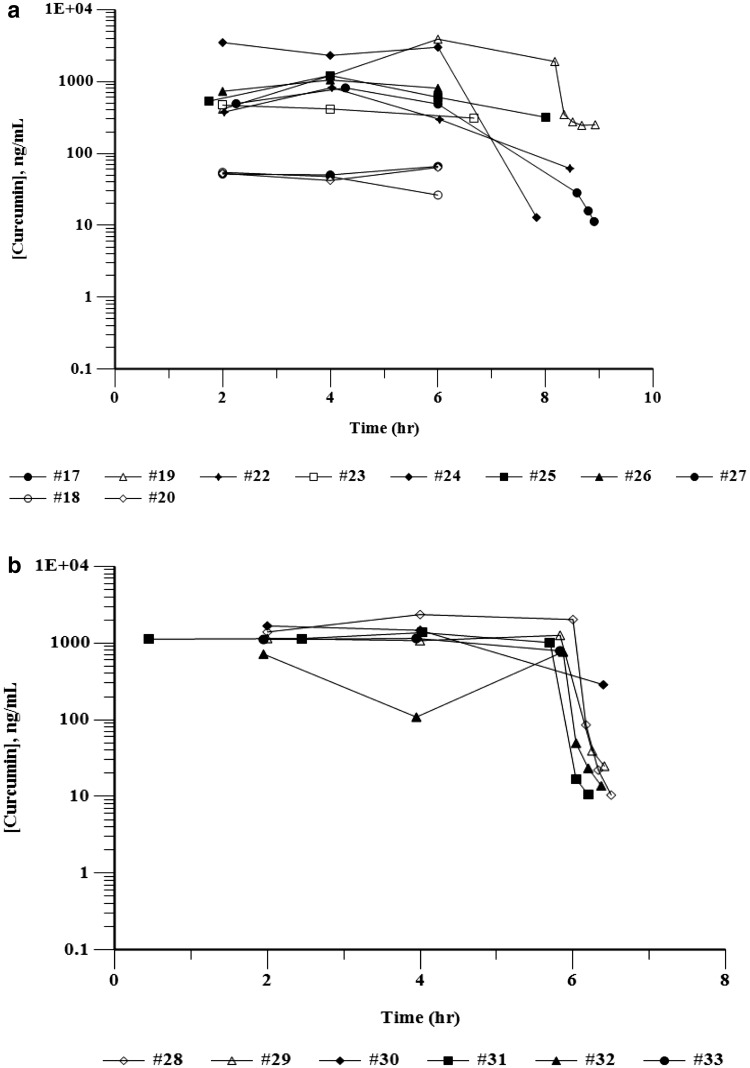
Fig. 1.
Curcumin plasma concentration curves during infusion with curcumin. Plasma levels of curcumin are shown for individual subjects. Time (h) represents the actual sampling times. Time “0” represents the start of infusion. a Patients #17–#27 receiving liposomal curcumin over 8 h. b Patients #28–#33 receiving liposomal curcumin over 6 h

