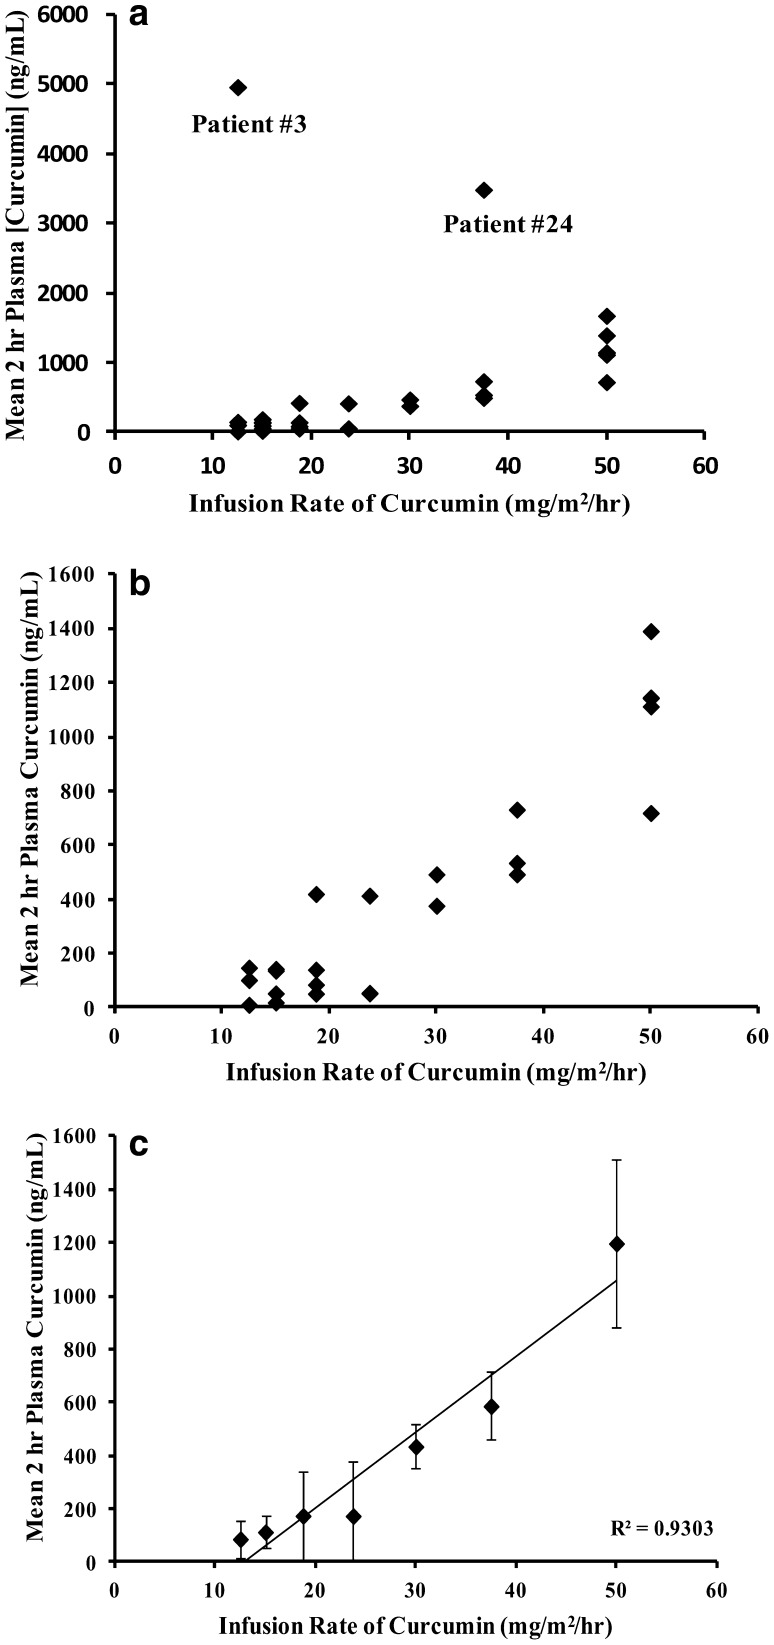
Fig. 2.
Plasma levels of curcumin at 2 h during infusion compared to the infusion rate. a For all patients with exception to patients #21 because of interruption of infusion, b for patients with the exclusion of patients #3, #21 and #24, c mean ± SD at each infusion rate for data shown in b. The infusion rate normalized 2 h curcumin levels were 7.0, 7.6, 9.3, 7.3, 14.5, 15.6, and 24.0 and infusion rates of 12.5, 15.0, 18.75, 23.75, 30.0, 37.5 and 50 mg/m2/h, respectively

