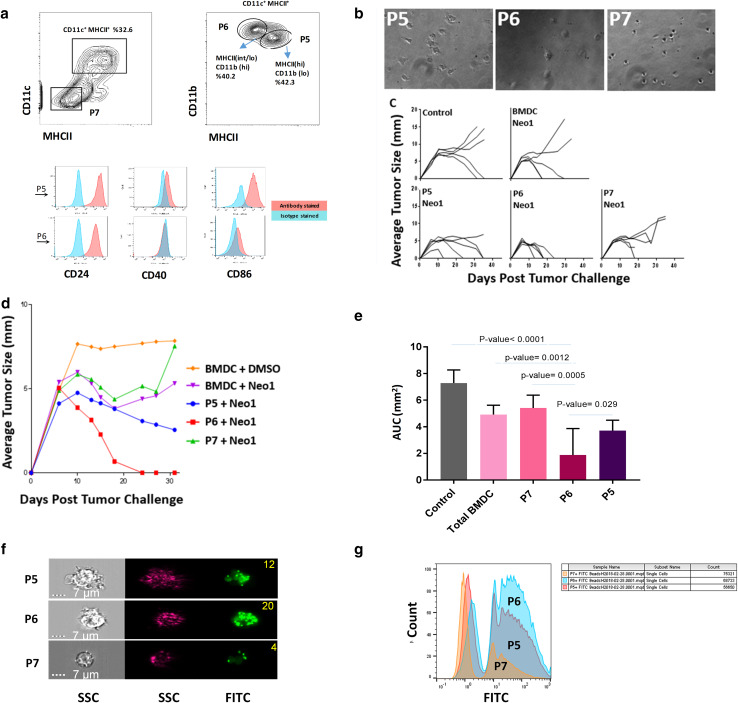
Fig. 3.
Sub-populations of BMDCs have distinct tumor rejection capacities. a The phenotype of GM-CSF-BMDCs cultures at day 7. CD11c+MHCII+ BMDCs (a, left) are divided further based on the CD11b expression (a, right; P6: MHCIIlo CD11bhi and P5: MHCIIhi CD11blo/int). Boxes represent gates and percentage of cells in each gate. Histograms indicate surface expression of the indicated markers by P5 (red) and P6 (blue) sub-sets. b shows the photomicrograph of P5, P6 and P7 cell sub-populations (200×). c shows tumor growth in BALB/cJ mice immunized with Neo1-pulsed 500,000 un-fractionated BMDCs, P5, P6 or P7 cells. All the immunizations were performed twice, 1 week apart with 9D9 treatment. Mice were challenged with Meth A cells and tumor growth monitored as in Fig. 1 (n = 5 per group). d shows the group average of tumor growth for panel c. e shows area under the curve (AUC) scores for each group of panel c. The AUC was calculated from day 6–31 since all groups showed uniform growth from day 0–6. The AUC value for P6 population was significantly lower than that of P5 (P = 0.029), P7 (P = 0.0005), total BMDC (P = 0.0012) and the control group (P < 0.0001). f Photomicrographs of P5, P6 and P7 sub-populations that were incubated with FITC microbeads. The right and middle panels represent the side-scattered images of the cells in the bright and dark field, respectively. The right panel shows the FITC channel. The number of the beads taken up by each sub-population is indicated at the top right corner of the image. g Cells were incubated with FITC and acquired by MACS Quant machine. X axis and Y axis represent the FITC channel and count, respectively. Experiments in panels a–g were done at least two times

