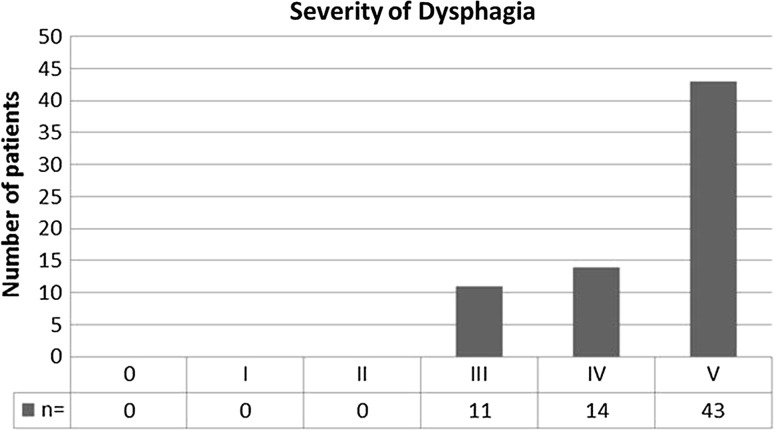
Fig. 2.
Frequency and degree of postoperative dysphagia based on the classification of Saeed et al. Columns from left to right: 0 = unable to swallow (0%), I = swallowing liquids with difficulty, solids impossible (0%), II = swallowing liquids without difficulty, solids impossible (0%), III = occasionally difficulty swallowing with solids (16%), IV = rarely difficulty swallowing with solids (21%), V = swallowing normally (63%)

