Fig. 2.

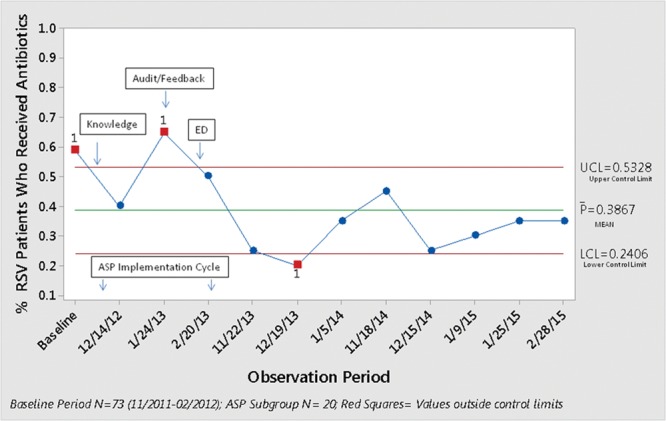
A control chart showing a reduction of patients exposed to antibiotics. The bar represents the average number of patients exposed to antibiotics during each season.

A control chart showing a reduction of patients exposed to antibiotics. The bar represents the average number of patients exposed to antibiotics during each season.