
Fig. 5.
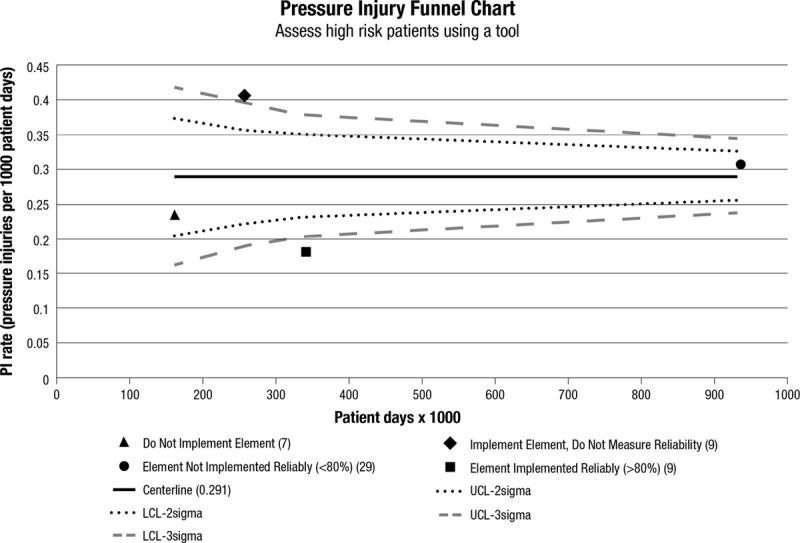
Funnel chart for phase 1 and 2 hospitals (n = 54). This bundle element is “using a tool to assess skin for high risk of pressure injury occurrence.” This funnel chart depicts the relationship between high bundle compliance and PI rates. (All other prevention bundle aspects/elements funnel charts are depicted in Appendix Figs. 1–7, Supplemental Digital Content 2, http://links.lww.com/PQ9/A1.)