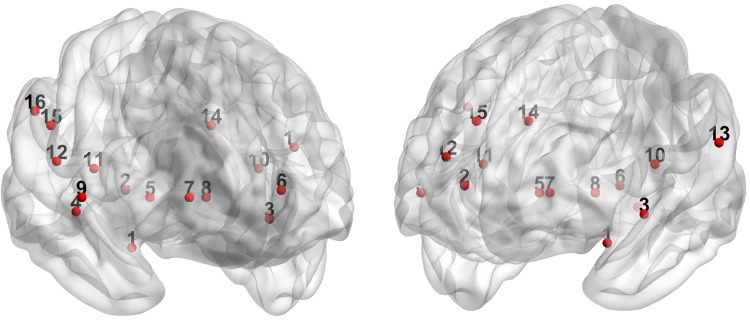
Fig. 1.
The pain network, based on the positive predictive weights of the NPS (Wager et al. 2013). Areas shown are: 1 = vermis cerebellum; 2 = anterior/mid insula (right); 3 = superior temporal gyrus; 4 = calcarine gyrus; 5 = ventrolateral thalamus (right); 6 = mid insula (left); 7 = hypothalamus; 8 = ventrolateral thalamus (left); 9 = frontal operculum/temporal pole; 10 = dorsal posterior insula/secondary somatosensory area (left); 11 = dorsal posterior insula (right); 12 = somatosensory area (right); 13 = temporoparietal junction; 14 = dorsal anterior cingulate cortex; 15 = supramarginal gyrus; 16 = inferior parietal lobule. BrainNet Viewer version 1.6 was used for visualization (http://www.nitrc.org/projects/bnv/) (Xia et al. 2013)

