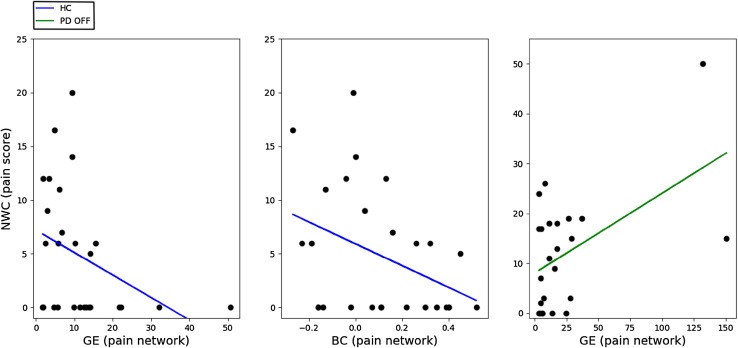
Fig. 3.
Plots of separate significant effects of the regression analyses. Left panel (blue): a negative linear association of GE of the pain network with NWC-scores for HC. Middle panel (blue): a negative linear association of BC of the pain network with NWC-scores for HC. Right panel (green): A positive linear association of GE of the pain network with NWC-scores for PD OFF. GE global efficiency, NWC number of words chosen, BC betweenness centrality, PD Parkinson’s disease, HC healthy controls, PD OFF PD patients during OFF phase

