
Fig. 6.
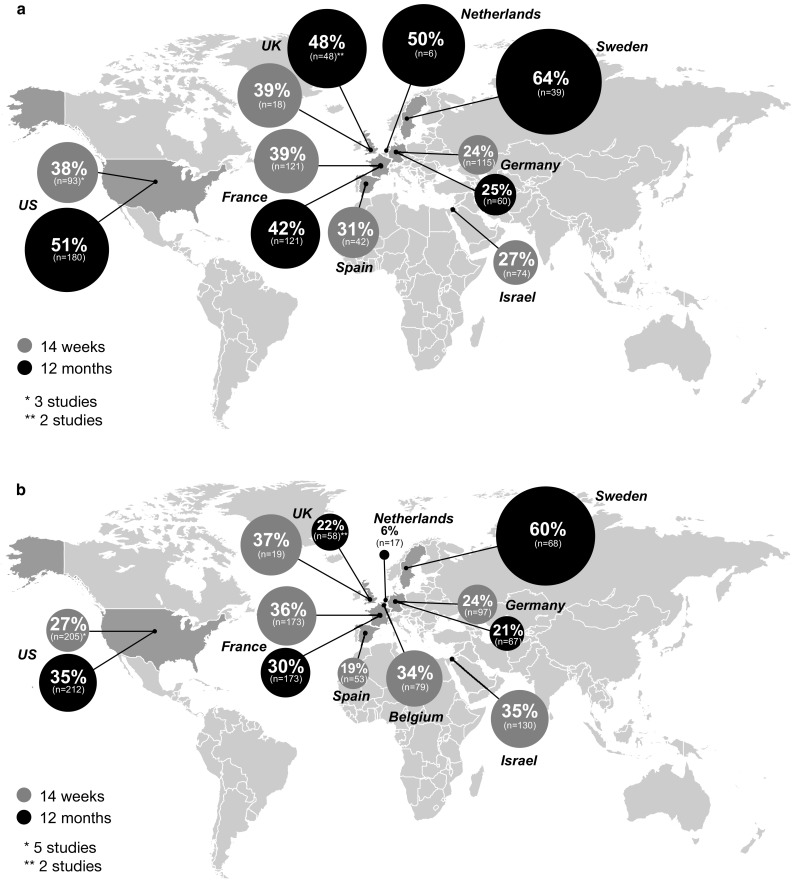
Subgroup analysis by geographical location showing clinical remission rates among patients with a ulcerative colitis and b Crohn’s disease. The size of each data bubble is proportional to the corresponding country clinical remission rates. Unless specified otherwise, one study was reported at each geographical location. Random-effects meta-analysis of single proportions was used to calculate an overall proportion in cases of > 1 study