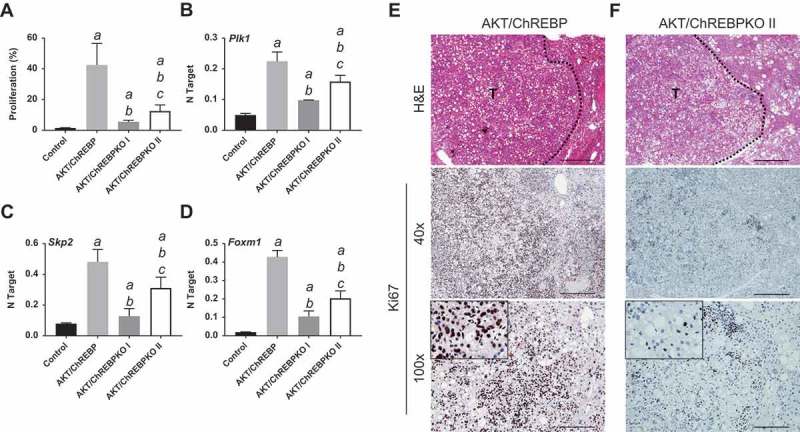
Figure 4.

Depletion of ChREBP results in decreased proliferation rate of AKT-overexpressing lesions. AKT/ChREBP mice (n = 15) were sacrificed 29 weeks post injection (w.p.i.). AKT/ChREBPKO mice (n = 15 for each group) were sacrificed at two distinct time points: 29 w.p.i. (indicated as AKT/ChREBPKO I) and 52 w.p.i. (AKT/ChREBPKO II), respectively. (a) Differences in proliferation indices (as assessed by Ki67 index) between controls (injected with empty vector), AKT/ChREBP, AKT/ChREBPKO I, and AKT/ChREBPKO II mice. (b–d). Differences in the mRNA levels of proliferation promoting genes (Plk1, Skp2, and Foxm1; as determined by quantitative real-time RT-PCR) in the same mouse cohorts. Quantitative values for Plk1, Skp2, and Foxm1 mRNA were calculated by using the PE Biosystems Analysis software and expressed as Number target (NT). NT = 2−ΔCt, wherein ΔCt value of each sample was calculated by subtracting the average Ct value of the target gene from the average Ct value of the β-Actin gene (housekeeping gene). Tukey–Kramer test: P < 0.0005 a, vs control (mice injected with empty vector); b, vs AKT/ChREBP; c, vs AKT/ChREBPKO I mice. (e) Large AKT/ChREBP HCC (T) characterized by very high rate of proliferation. (f) Low proliferative activity in an AKT/ChREBPKO II HCC (T). The striking differences in proliferation degree can be better appreciated in insets. HCC are demarcated from the surrounding non-tumorous tissue with dotted lines. Original magnifications: 40x and 100x in the large pictures, 400x in insets. Scale bar: 500µm for 40x, 100µm for 100x. Abbreviations: HE, hematoxylin and eosin staining; T, tumor (HCC).
