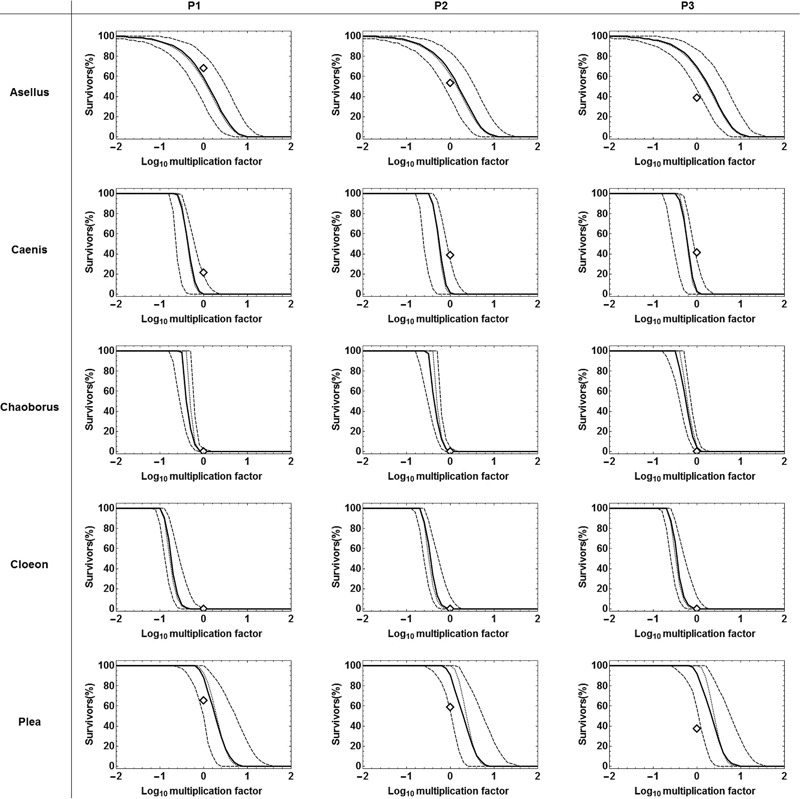
Fig. 4.

Predictions of exposure-profile specific dose-response curves for the 3 tested pulsed exposure regimes for imidacloprid, based on calibration to results from acute testing (exp. MS_C1) using the SD model. Diamonds indicate the observed number of living organisms (exp. MS_V) at the end of a specific experiment. The dashed lines shown the 5 and 95 percentile of 10,000 probabilistic simulations of the time course of survival (ref. section ESM2.2.4.3) per multiplication factor, the solid line is the respective median. Black dotted lines show the deterministic rate of survivors
