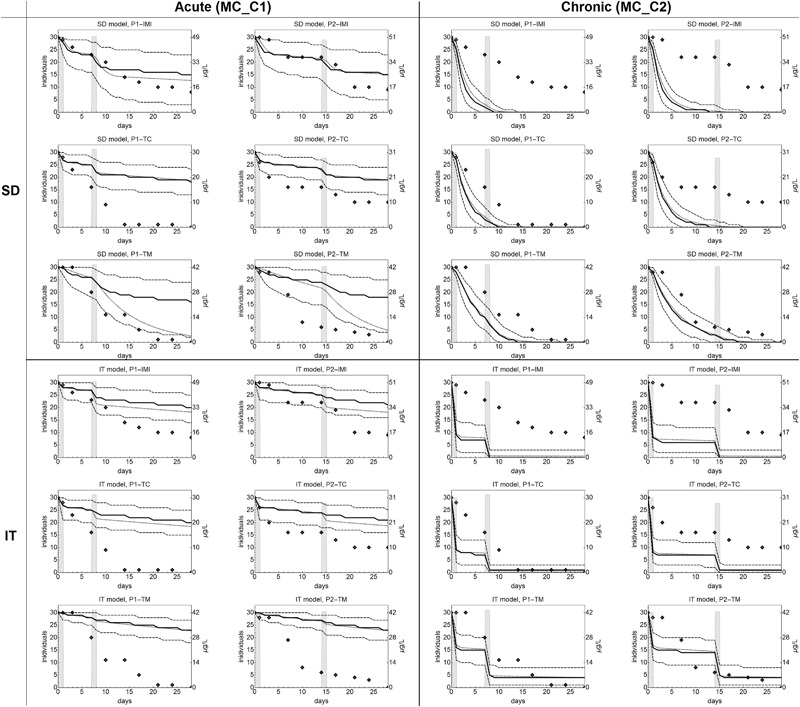
Fig. 5.

Observed and predicted survival in experiment MC_V. The single plots show survival of C. dipterum under exposure to imidacloprid (IMI), thiacloprid (TC), thiametoxam (TM)) with the SD model (3 top rows) and the IT model (3 bottom rows), model calibration based on data from acute (MC_C1, left columns) or chronic experiments (MC_C2, right columns). Diamonds indicate observed numbers of living organisms (exp. MC_V). The dashed lines shown the 5 and 95 percentile of 10.000 probabilistic simulations of the time course of survival (see ref. ESM2.2.4), the solid line is the respective median. Black dotted lines show the deterministic rate of survivors. Grey bars show the exposure levels over time, measured concentrations as indicated in the axes labels on the right hand side of the single panels
