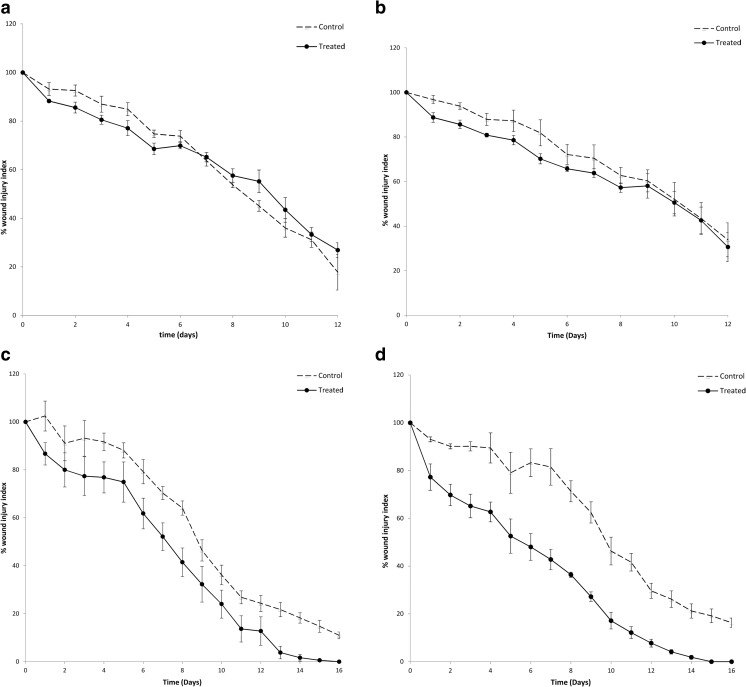
Fig. 6.
Percent wound injury index of a group non-DB-H, b group non-DB-NP, c group DB-H and d group DB-NP. Results show mean ± SME (n = 4). Paired t test results showed the statistical data of percent injury index of control and treated wounds. Non-significant difference (p > 0.05) (a) and significant difference *(p < 0.001) (b–d)

