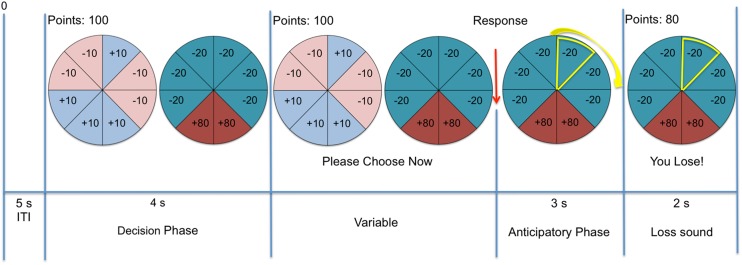
Fig. 1.
A schematic representation of one trial of the modified Risky Choice Task used in this study. The control gamble is shown on the left side and has an expected value of 0 (0.5 × 10 + 0.5 × −10). The experimental gamble is shown on the right side and has an expected value of +5 (0.75 × −20 + 0.25 × 80). The difference in expected values (delta) between the gambles is therefore +5, so the experimental gamble is more favourable than the control gamble in this instance. Following the participant’s response (i.e., choice of one gamble), the yellow highlight spins around the wheel, gradually slowing until it stops on one of the wedges. The participant receives visual and auditory feedback, as well as being presented with the updated points total after each trial

