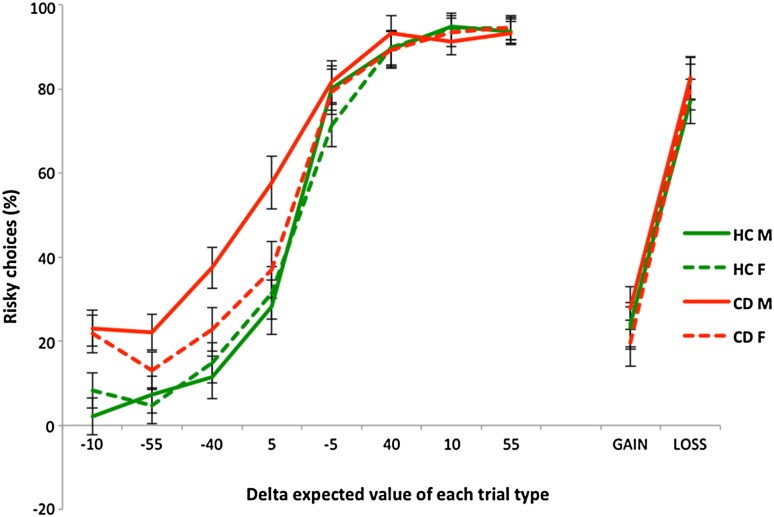
Fig. 2.
Mean percentage of risky choices according to expected value, by group. Error bars represent ±1 standard error of the mean. HCM healthy control males, HCF healthy control females, CDM conduct disorder males, CDF conduct disorder females. The gain and loss trials show the data for the positive and negative reflection trials, respectively

