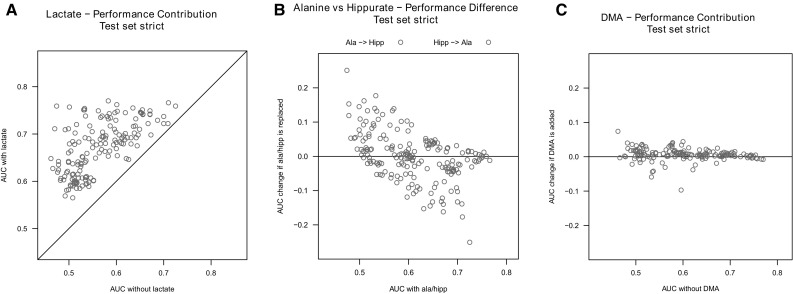
Fig. 3.

Manual model selection based on AUC comparison in the test set. All graphs show the effect on AUC of different variations of models. a Analysis of effect of adding Lactate. Models substantially improves in performance when lactate was added as another independent variable—all data points are found above the diagonal. b Analysis of effect of exchanging Alanine and Hippurate: on average, AUC was greater, when Alanine was used as an independent variable instead of hippurate—the magenta points are mostly found above the blue points, although the absolute improvement is small. c Analysis of effect of adding DMA. Adding DMA to a model seems to improve performance (data pints above the black line). However the amount of performance gain is negligible at 0.01–0.04 points in the AUC
