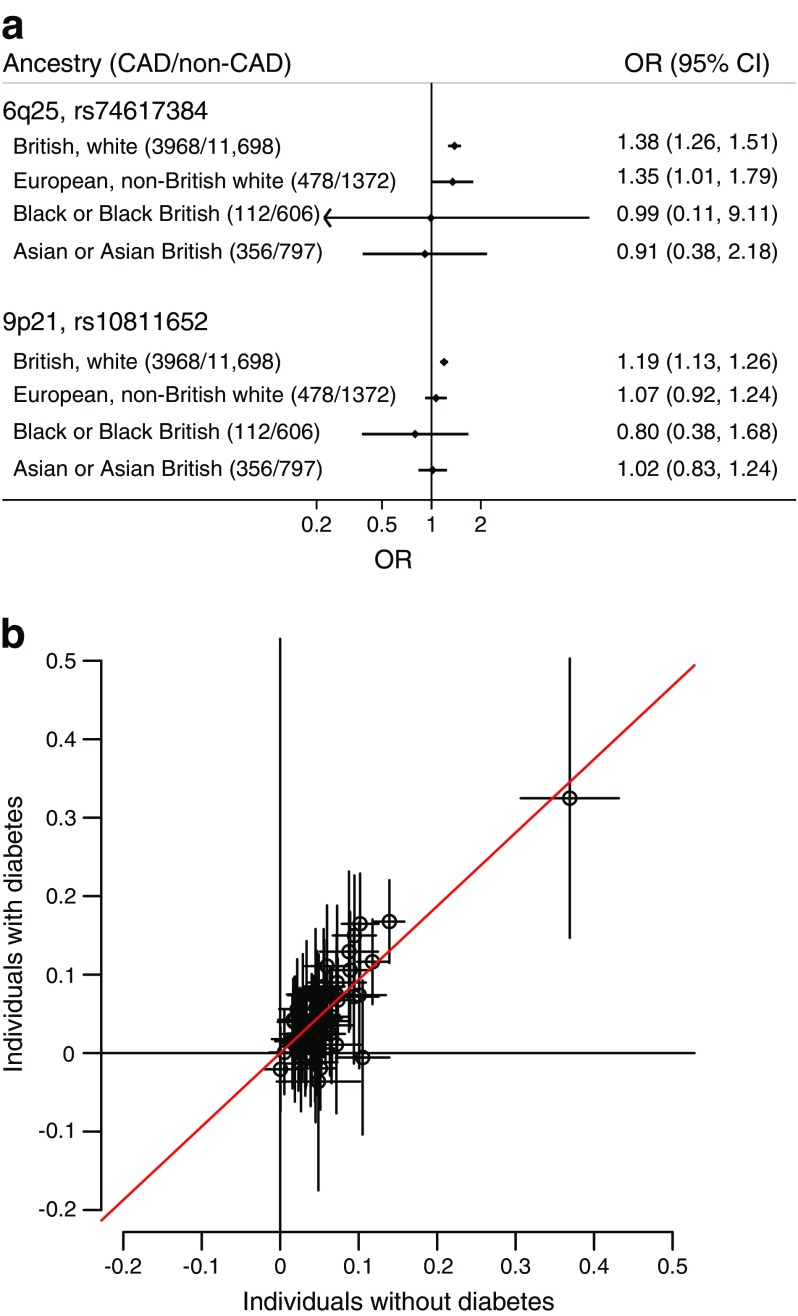
Fig. 2.
(a) Association of the two genetic variants associated with CAD among individuals with diabetes in different ancestry groups. (b) Scatterplot of the estimated CAD effects for 61 previously reported CAD variants in UK Biobank participants with diabetes (n = 15,666) compared with the UK Biobank participants without diabetes (n = 321,281). Estimates on the scatterplot are loge-transformed ORs with 95% CIs. The slope from a weighted linear regression without intercept is 0.93 (95% CI 0.80, 1.07) and is shown as a red line

