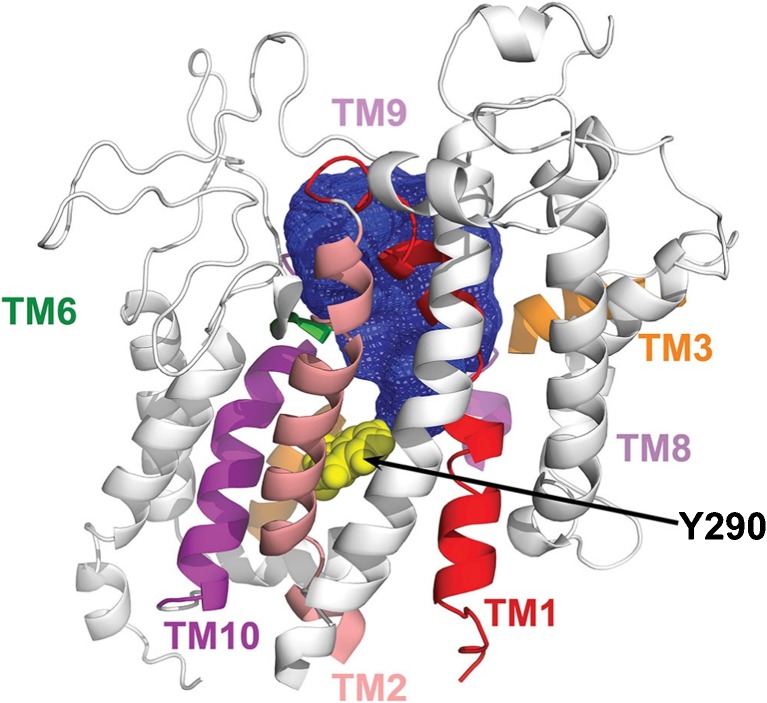
Fig. 8.
The external vestibule of human SGLT1 in the outward facing, sodium-bound conformation (Fig. 6, state 2). The vestibule was mapped using fluorescent reagents covalently bound to cysteine residues in the sugar-binding site, e.g. tetramethylrhodamine (TAMRA) bound to Y290C. The location of transmembrane helices (TM) of the structural model of SGLT1 are shown (some helices have been removed for clarity), along with the boundary of the 600 Å3 vestibule (blue area) bounded by the outer ends of TM1, TM2, TM3, TM6, TM9 and TM10. Reproduced from [47], distributed under the terms of the Creative Commons Attribution-NonCommerical-NoDerivatives International License 4.0 (CC BY-NC-ND; https://creativecommons.org/licenses/by-nc-nd/4.0/). This figure is available as part of a downloadable slideset

