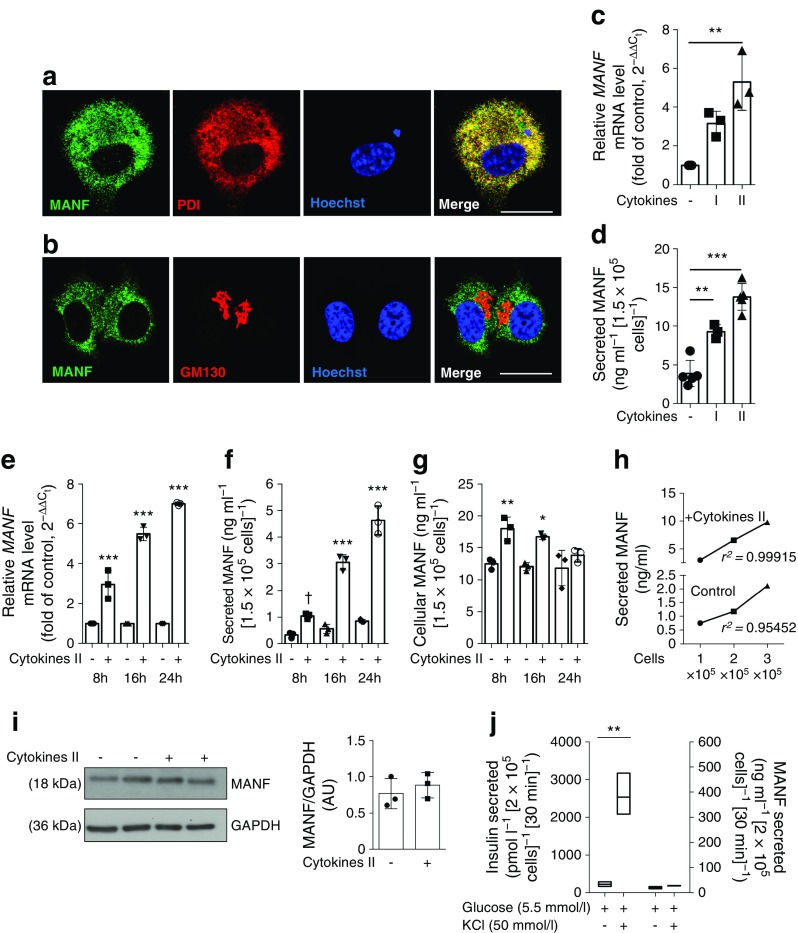
Fig. 2.
Cytokines induce MANF expression and secretion in EndoC-βH1 cells. (a, b) Immunofluorescence analysis for co-localisation of MANF (green) and (a) PDI (an ER marker; red) and (b) GM130 (a Golgi marker, red) in EndoC-βH1 cells. Nuclei were stained with Hoechst (blue). Scale bars, 25 μm. (c) MANF mRNA expression by qRT-PCR and (d) MANF secretion in supernatant fractions from culture, quantified by ELISA in EndoC-βH1 cells stimulated with cytokine cocktail I or II for 24 h and 48 h, respectively. (e–g) EndoC-βH1 (1.5 × 10⁵ seeded) cells were treated with cytokine cocktail II for a time course of 8 h, 16 h and 24 h and analysed for (e) MANF mRNA expression, (f) secreted MANF in the supernatant fraction and (g) cellular MANF normalised to total protein content. Statistical comparisons are between the cytokine treated vs control condition of the same timepoint. (h) 1 × 10⁵, 2 × 10⁵ and 3 × 10⁵ cells were treated with cytokine cocktail II for 24 h. Secreted MANF in the supernatant fraction was quantified with ELISA. (i) Western blot analysis of MANF protein and densitometric analysis for band intensities normalised to glyceraldehyde 3-phosphate dehydrogenase (GAPDH) in EndoC-βH1 cells treated with cytokine cocktail II for 24 h. (j) EndoC-βH1 cells were stimulated with either 5.5 mmol/l glucose alone or in presence of 50 mmol/l KCl for 30 min, and the supernatant fraction was quantified for both insulin and MANF protein using ELISA. qRT-PCR data were normalised to the housekeeping gene cyclophilin G. Cytokine cocktail I, IL-1β + IFN-γ; cytokine cocktail II, IL-1β + IFN-γ + IL-17 + TNF-α. Data represent the mean ± SD of at least three independent experiments. *p < 0.05, **p < 0.01, ***p < 0.001; †p = 0.0507 (one-way ANOVA followed by Tukey’s test). AU, arbitrary units

