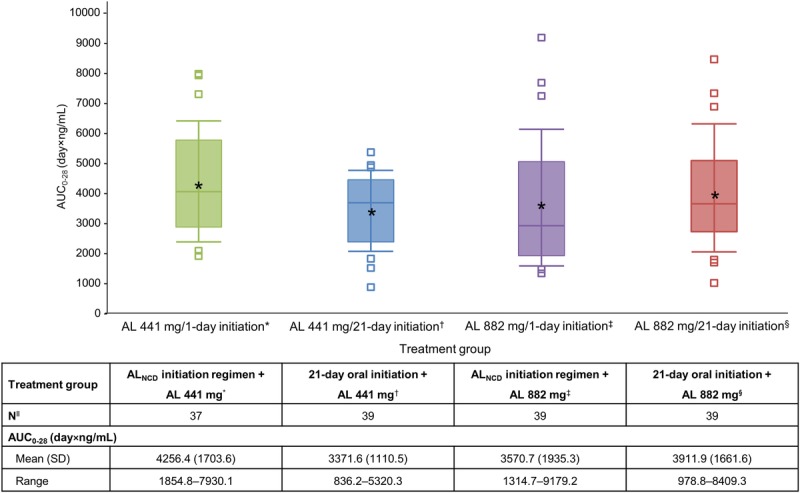
FIGURE 4.

Box plot of AUC0–28 for aripiprazole, by starting AL dose/initiation regimen. The boxes represent the 25th and 75th percentiles of aripiprazole concentration, the line within each box marks the median, the asterisk indicates the mean, and the whiskers indicate the 10th and 90th percentiles. The squares represent individual observations beyond the 10th and 90th percentiles. *AUC0–28 values could not be estimated for all patients because some patients discontinued the study before day 28.
