FIGURE 3.

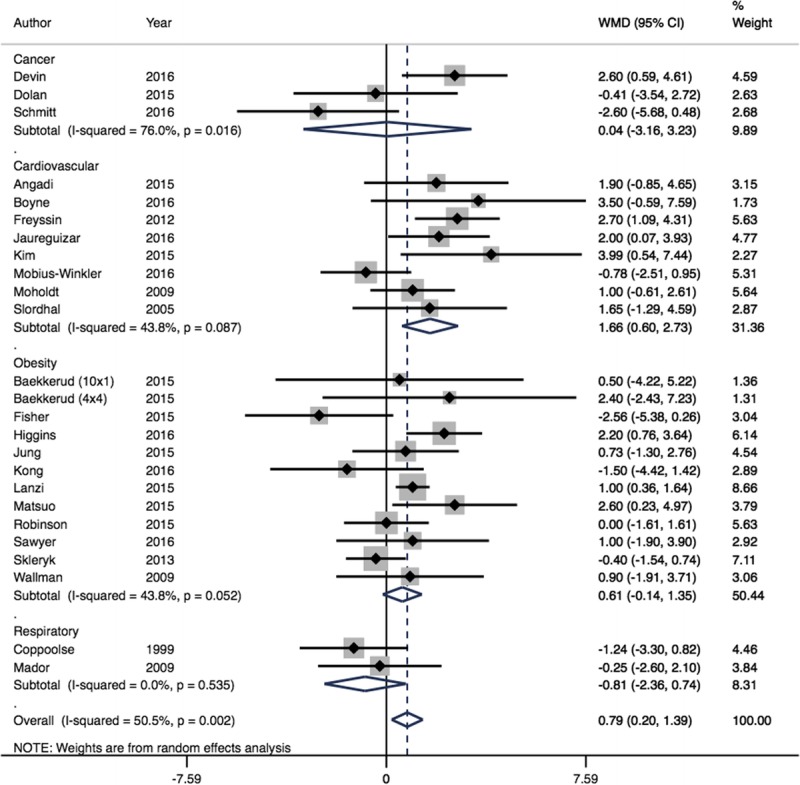
Forest plot showing meta-analysis of V˙O2peak data for HIIT vs MCT (WMD mL·kg−1·min−1). Diamonds to the right of the plot show benefit with HIIT.

Forest plot showing meta-analysis of V˙O2peak data for HIIT vs MCT (WMD mL·kg−1·min−1). Diamonds to the right of the plot show benefit with HIIT.