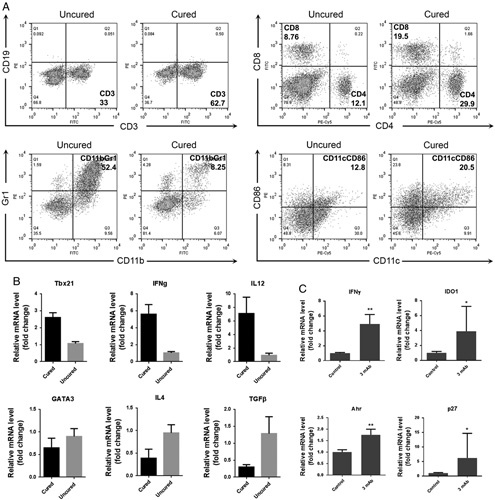
FIGURE 7.

A and B, Flow cytometry and quantitative polymerase chain reaction data for lymphoid cells of spleen from mice whose TC1 tumors were either completely regressed (cured) or not regressed (uncured) 3 days after the last treatment with the 4 mAb combination plus cisplatin. C, Quantitative polymerase chain reaction data for tumors from mice whose tumors were stable 3 days after the last treatment of 3 mAb combination as compared to untreated tumor-bearing control mice. IFN indicates interferon; IL, interleukin; mAb, monoclonal antibody.
