Figure 1.
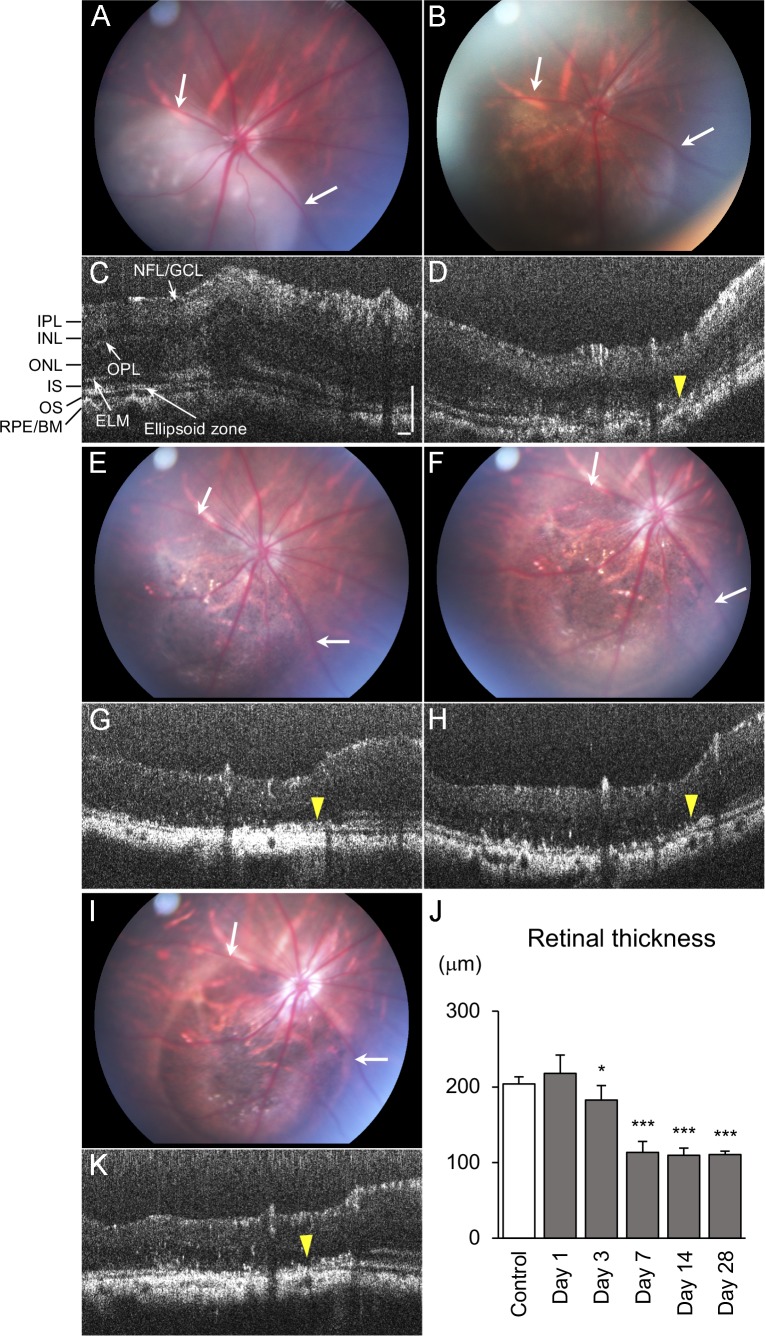
Sequential monitoring of the same eye with fundus photograph and spectral domain OCT scans at 1 (A, C), 3 (B, D), 7 (E, G), 14 (F, H), and 28 (I, K) days after NaIO3 injection. Note the area of retinal atrophy was observed at 1 day and did not expand with time (arrows). A distinct transition zone is observed between nonaffected retina and damaged retina after day 3, where the RPE/Bruch's membrane complex is irregular and discontinuous, and retinal thinning is observed (yellow arrowhead). (J) The graph shows retinal thickness after injection, indicating thinning was observed at day 3, and the atrophy was completed by day 7. Error bars denote SD (control, n = 6; day 1, n = 13; days 3, 7, n = 11; day 14, n = 4; day 28, n = 4; *P < 0.05, ***P < 0.001; two-tailed Student's t-test). Scale bars indicate 100 μm (NFL, nerve fiber layer; GCL, ganglion cell layer; IPL, inner plexiform layer; INL, inner nuclear layer; OPL, outer plexiform layer; ONL, outer nuclear layer; IS, inner segment; ELM, external limiting membrane; OS, outer segment; BM, Bruch's membrane).

