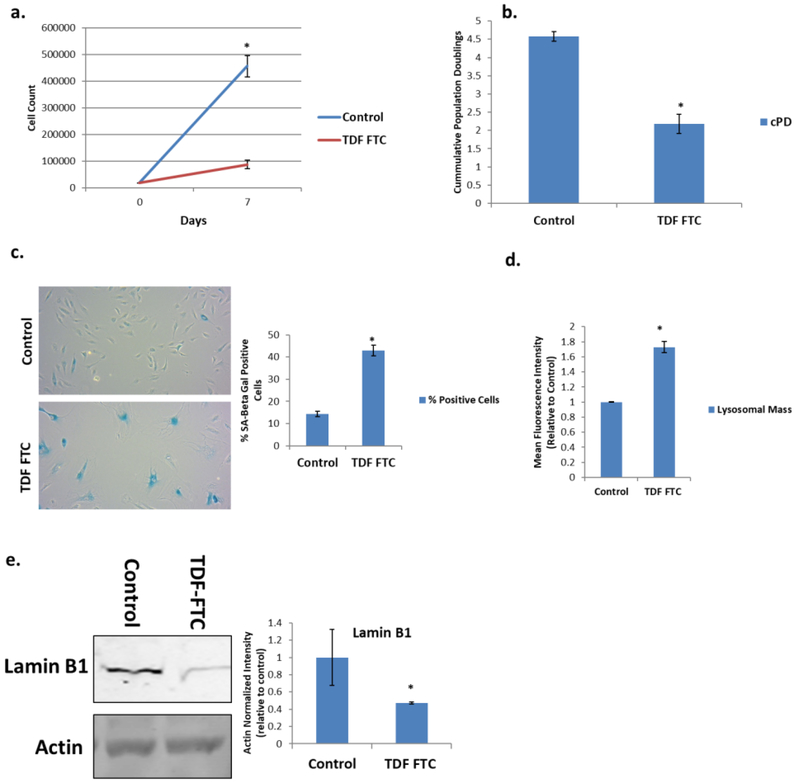
Figure 1. Expression of Senescence Markers in HAART Drug Treated HUVECs.
HUVECs were treated with 10 μg/mL of tenofovir (TDF) and emtricitibine (FTC) for 7 days. (A) Growth curve. (B) Population doublings over one week. (C) Left, representative SA β-gal images displayed at 20X of human astrocytes stained for SA β-gal 1 week after HAART treatment. Right, quantification of images. (D) Lysosomal mass was measured by incubation with Lysotracker for 30 min followed by quantification on a flow cytometer. (E) Left, representative western blot of senescence markers lamin B1 and loading control. Right, quantification. * = p value < .05, n = 3, error bars are S.D.

