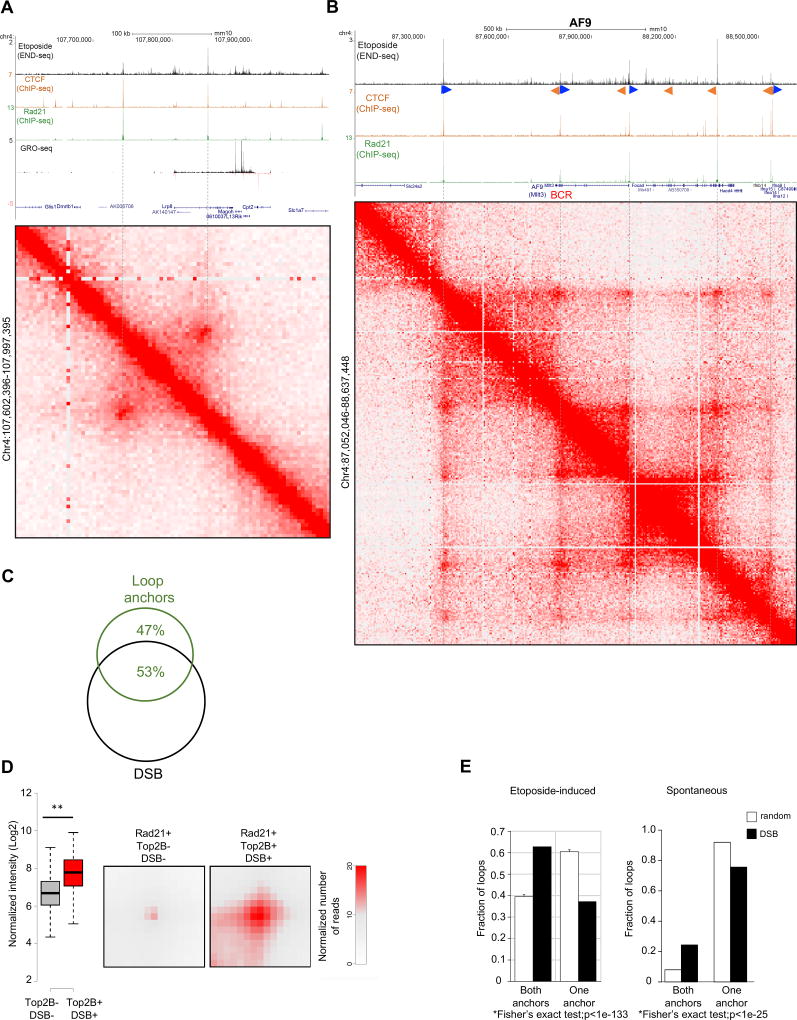
Figure 5. Loop anchor location and strength are associated with DSBs.
(A) Top to bottom: DSBs profiles upon ETO treatment, CTCF and RAD21 occupancy measured by ChIP-seq; RNA synthesis by GRO-seq; and Hi-C contact matrices (position chr4:107,602,396–107,997,395, mm10) showing a loop near the Lrp8 gene. DSBs colocalize to loop anchor positions (dashed lines). (B) Oncogenic breakpoint cluster region (BCR) within the MLL translocation partner AF9 overlaps with loop anchor position, CTCF/cohesin binding and DSBs (See also Figure S4). From top to bottom: DSBs profiles upon ETO treatment, CTCF and Rad21 occupancy measured by ChIP-seq; and Hi-C contact matrices for chr4 (positions 87,052,046 to 88,637,448, mm10), which reveals multiple chromatin loop interactions (resolution 5kb). G-rich and C-rich orientation of the CTCF motifs, are shown as blue, respectively. BCR position is indicated in red. (C) Overlap between loop anchors and DSBs. Loop anchors were defined as regions within 5kb from the Hi-C loop boundary (see Methods) with CTCF and RAD21 co-binding. Loop anchor regions, identified by Hi-C, were considered overlapping with DSBs if intersecting with at least one END-seq peak. The level of overlap between loop anchors and DSBs was greater than the overlap between loop anchors and randomly generated CTCF/RAD21 double peaks (Hypergeometric test, p<1×10⁻¹⁵). (D) Aggregate peak analysis (APA) plots display the average Hi-C signal at anchor loop positions (RAD21+) that are either associated or not with DSBs. Left panel, whisker plot representation of the normalized signal between anchor loops associated or not with DSBs (two-sided t-test, p<1×10⁻²⁵); right panel, aggregate signal at loop anchor positions. Aggregate peak signal shown in red indicates that DSB-associated anchors have stronger loop interactions. (E) Percentage of loop borders positive for DSBs that either have DSBs on both sides (see for example Figure 5A) or only on one side (observed), compared to randomly paired anchors (expected) (Fisher’s exact test, p<1×10−133). Left and right panels quantify ETO-induced and spontaneous breaks respectively.

